
SLIDE 1
HGCCC Annual Report
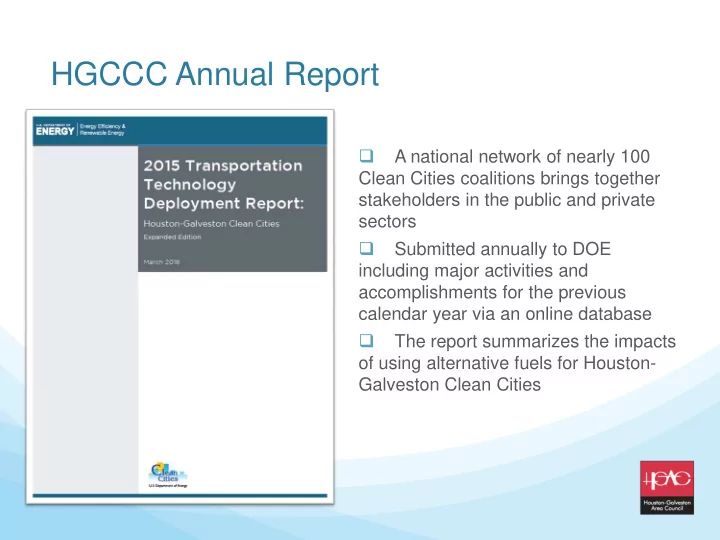
A national network of nearly 100 Clean Cities coalitions brings together stakeholders in the public and private sectors Submitted annually to DOE including major activities and accomplishments for the previous calendar year via an online database The report summarizes the impacts
- f using alternative fuels for Houston-