
1
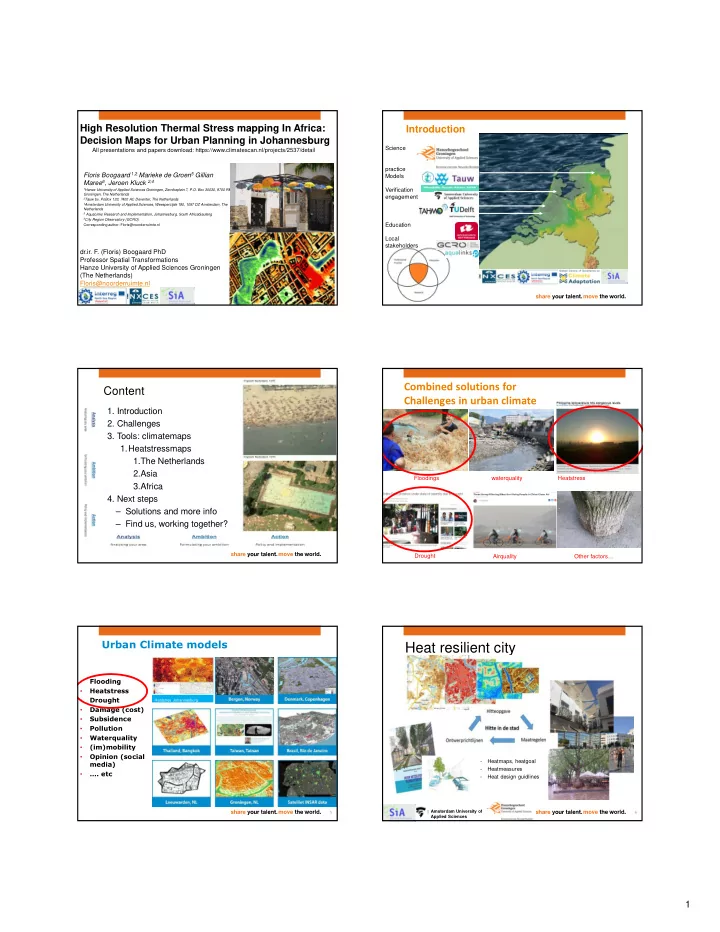
High Resolution Thermal Stress mapping In Africa: Decision Maps for Urban Planning in Johannesburg
Floris Boogaard 1,2 Marieke de Groen5 Gillian Maree6, Jeroen Kluck 2,4
1Hanze University of Applied Sciences Groningen, Zernikeplein 7, P.O. Box 30030, 9700 RM
Groningen, The Netherlands
2Tauw bv, PoBox 133, 7400 AC Deventer, The Netherlands 4Amsterdam University of Applied Sciences, Weesperzijde 190, 1097 DZ Amsterdam, The
Netherlands
5 AquaLinks Research and Implementation, Johannesburg, South AfricaGauteng 6City Region Observatory (GCRO)
Corresponding author: Floris@noorderruimte.nl
dr.ir. F. (Floris) Boogaard PhD Professor Spatial Transformations Hanze University of Applied Sciences Groningen (The Netherlands) Floris@noorderruimte.nl
All presentations and papers download: https://www.climatescan.nl/projects/2537/detail
Introduction
Science practice Models Verification engagement Education Local stakeholders
- 1. Introduction
- 2. Challenges
- 3. Tools: climatemaps
1.Heatstressmaps 1.The Netherlands 2.Asia 3.Africa
- 4. Next steps
– Solutions and more info – Find us, working together?
Content Combined solutions for Challenges in urban climate
waterquality Floodings Heatstress Airquality Other factors… Drought
Urban Climate models
5
- Flooding
- Heatstress
- Drought
- Damage (cost)
- Subsidence
- Pollution
- Waterquality
- (im)mobility
- Opinion (social
media)
- …. etc
Heatstres Johannesburg
Heat resilient city
6
Amsterdam University of Applied Sciences
- Heatmaps, heatgoal
- Heatmeasures
- Heat design guidlines