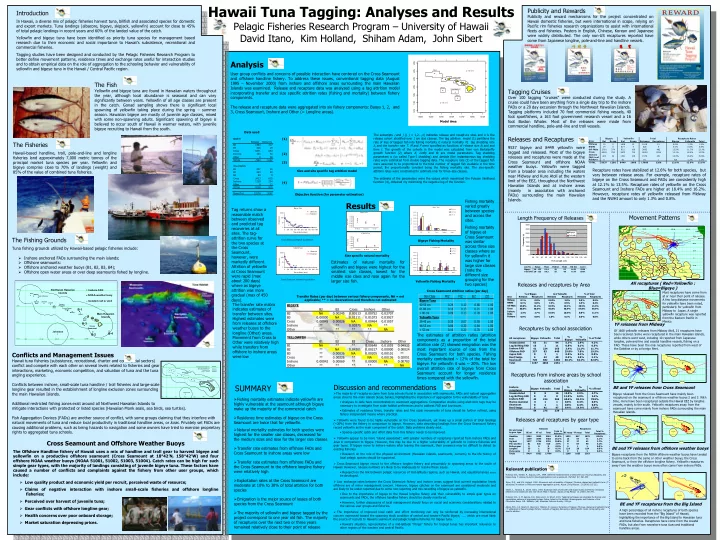

Hawaii Tuna Tagging: Analyses and Results
Pelagic Fisheries Research Program – University of Hawaii David Itano, Kim Holland, Shiham Adam, John Sibert
The Fish
Yellowfin and bigeye tuna are found in Hawaiian waters throughout the year, although local abundance is seasonal and can vary significantly between years. Yellowfin of all age classes are present in the catch. Gonad sampling shows there is significant local spawning of yellowfin taking place during the spring – summer
- season. Hawaiian bigeye are mostly of juvenile age classes, mixed
with some non-spawning adults. Significant spawning of bigeye is believed to occur south of Hawaii in warmer waters, with juvenile bigeye recruiting to Hawaii from the south.
The Fishing Grounds
Tuna fishing grounds utilized by Hawaii-based pelagic fisheries include: Inshore anchored FADs surrounding the main islands; Offshore seamounts: Offshore anchored weather buoys (B1, B2, B3, B4); Offshore open water areas or over deep seamounts fished by longline.
Conflicts and Management Issues
Hawaii tuna fisheries (subsistence, recreational, charter and commercial sectors) conflict and compete with each other on several levels related to fisheries and gear interactions, marketing, economic competition, and valuation of tuna and the tuna angling experience. Conflicts between inshore, small-scale tuna handline / troll fisheries and large-scale longline gear resulted in the establishment of longline exclusion zones surrounding the main Hawaiian Islands. Additional restricted fishing zones exist around all Northwest Hawaiian Islands to mitigate interactions with protected or listed species (Hawaiian Monk seals, sea birds, sea turtles). Fish Aggregation Devices (FADs) are another source of conflict, with some groups claiming that they interfere with natural movements of tuna and reduce local productivity in traditional handline areas, or koas. Privately set FADs are causing additional problems, such as being hazards to navigation and some owners have tried to exercise proprietary rights to aggregated tuna schools. 9537 bigeye and 8449 yellowfin were tagged and released. Most of the bigeye releases and recaptures were made at the Cross Seamount and
- ffshore
NOAA weather buoys. Yellowfin were tagged from a broader area including the waters near Midway and Kure Atoll at the western limit of the EEZ, throughout the Northwest Hawaiian Islands and at inshore areas (mainly in association with anchored FADs) surrounding the main Hawaiian Islands.
Movement Patterns
Analysis
User group conflicts and concerns of possible interaction have centered on the Cross Seamount and offshore handline fishery. To address these issues, conventional tagging data (August 1995 – November 2000) from inshore and offshore areas surrounding the main Hawaiian Islands was examined. Release and recapture data was analyzed using a tag attrition model incorporating transfer and size specific attrition rates (fishing and mortality) between fishery components. The release and recapture data were aggregated into six fishery components: Buoys 1, 2, and 3, Cross Seamount, Inshore and Other (= Longline areas).
Publicity and Rewards
Publicity and reward mechanisms for the project concentrated on Hawaii domestic fisheries, but were international in scope, relying on Pacific rim fisheries research organizations to assist with international fleets and fisheries. Posters in English, Chinese, Korean and Japanese were widely distributed. The only non-US recaptures reported have come from Japanese longline, pole-and-line and handline vessels.
Tagging Cruises
Over 100 tagging “cruises” were conducted during the study. A cruise could have been anything from a single day trip to the inshore FADs or a 20 day excursion through the Northwest Hawaiian Islands. Tagging platforms included 70 foot commercial fishing vessels, 40 foot sportfishers, a 163 foot government research vessel and a 16 foot Boston Whaler. Most of the releases were made from commercial handline, pole-and-line and troll vessels.
The Fisheries
Hawaii-based handline, troll, pole-and-line and longline fisheries land approximately 7,000 metric tonnes of the principal market tuna species per year. Yellowfin and bigeye comprise close to 70% of landings (weight) and 85% of the value of combined tuna fisheries.
Introduction
In Hawaii, a diverse mix of pelagic fisheries harvest tuna, billfish and associated species for domestic and export markets. Tuna landings (albacore, bigeye, skipjack, yellowfin) account for close to 45%
- f total pelagic landings in recent years and 60% of the landed value of the catch.
Yellowfin and bigeye tuna have been identified as priority tuna species for management based research due to their economic and social importance to Hawaii’s subsistence, recreational and commercial fisheries. Tagging studies have been designed and conducted by the Pelagic Fisheries Research Program to better define movement patterns, residence times and exchange rates useful for interaction studies and to obtain empirical data on the role of aggregation to the schooling behavior and vulnerability of yellowfin and bigeye tuna in the Hawaii / Central Pacific region. Relevant publications
Holland, K.N., Kleiber, P., Kajiura, S.M., 1999. Different residence times of yellowfin tuna Thunnus albacares, and bigeye tuna T. obesus, found in mixed aggregations over a seamount. Fish Bull. 97, 392-395. Itano, D.G., and K.N. Holland. 2000. Movement and vulnerability of bigeye (Thunnus obesus) and yellowfin tuna (T. albacares) in relation to FADs and natural aggregation points. Aquat. Living Resour. 13 (2000) 213-223. Sibert, J., Holland, K., and D. Itano. 2000. Exchange rates of yellowfin and bigeye tunas and fishery interaction between Cross Seamount and near-shore FADs in Hawaii. Aquat. Living Resour. 13 (2000) 233-240. Holland, K.N., S. M. Kajiura, D.G. Itano and J. R. Sibert. 2001. Tagging techniques can elucidate the biology and exploitation patterns of aggregated pelagic fishes. Island in the Stream: Oceanography and Fisheries of the Charleston Bump. G.R. Sedberry (ed). American Fisheries Society. 252 pp. Adam, M.S., J.R. Sibert, D. Itano & K. Holland. (In review). Dynamics of bigeye (Thunnus obesus) and yellowfin tuna (T. albacares) in Hawaii's pelagic fishery: analysis of tagging data using a bulk transfer model incorporating size specific attrition. 20 N 180 15 N 175 W 30 N 15 N Northwest Hawaiian Islands Johnston Atoll 170 W 165 W 160 W 155 W MHI Longline prohibited zones NWHI Longline prohibited zone 200 mile Exclusive Economic Zone Throughout the year October 1 - January 31 Main Hawaiian Islands Bigeye Yellowfin Total Recapture Rates Area Rel Recap Rel Recap Releases Recaptures Bigeye Yellowfin Total Midway 10 1608 21 1618 21 0.0% 1.3% 1.3% NWHI 14 614 5 628 5 0.0% 0.8% 0.8% Off FADs 2761 374 922 108 3683 482 13.5% 11.7% 13.1% Cross 6529 792 3873 714 10402 1506 12.1% 18.4% 14.5% Inshore FAD/reef 223 32 1351 219 1574 251 14.3% 16.2% 15.9% Palmyra 81 1 81 1 NA 1.2% 1.2% TOTAL 9537 1198 8449 1068 17986 2266 12.6% 12.6% 12.6%Recapture rates have stabilized at 12.6% for both species, but vary between release areas. For example, recapture rates of bigeye on the Cross Seamount and FADs are consistently high at 12.1% to 13.5%. Recapture rates of yellowfin on the Cross Seamount and Inshore FADs are higher at 18.4% and 16.2%. However, recapture rates of yellowfin released from Midway and the NWHI amount to only 1.3% and 0.8%.
500 1000 1500 2000 2500 3000 3500 20 30 40 50 60 70 80 90 100 110 120 130 140 Fork Length (cm) Frequency (n) Bigeye Yellowfin Releases Recaptures Rel and recap by gear type BE rel YF rel Total Total % Releases BE recap YF recap Total Total % Recaptures Handline 5962 3099 9061 51.0% 1032 847 1879 83.0% Troll 1359 3094 4453 25.1% 14 57 71 3.1% Jig/bait 1977 1724 3701 20.8% 27 37 61 2.7% Pole and line 81 434 515 2.9% 9 87 96 4.2% Bottom gear 0.0% 1 1 0.0% Longline 35 1 36 0.2% 126 28 154 6.8% Purse seine 0.0% 1 1 0.0% Totals 9414 8352 17766 1208 1055 2263Releases and Recaptures
Length Frequency of Releases Releases and recaptures by Area Recaptures by school association Recaptures from inshore areas by school association Releases and recaptures by gear type
% of Bigeye & of Yellowfin % of Total Area Releases Recaptures Releases Recaptures Releases Recaptures Midway 0.1% 0.0% 19.0% 2.0% 9.0% 0.9% NWHI 0.1% 0.0% 7.3% 0.5% 3.5% 0.2% Off FADs 29.0% 31.2% 10.9% 10.1% 20.5% 21.3% Cross 68.5% 66.0% 45.8% 66.9% 57.8% 66.4% Inshore FADs 2.3% 2.7% 16.0% 20.5% 8.8% 11.1% Palmyra 0.0% 0.0% 1.0% 0.1% 0.5% 0.0% All recaptures Bigeye Yellowfin Total % Bigeye % Yellowfin % of Total Unassociated 63 31 94 5.3% 2.9% 4.2% Log/drifting FAD 10 1 11 0.8% 0.1% 0.5% Inshore FAD 41 224 265 3.4% 21.1% 11.7% Offshore FAD 357 83 440 29.8% 7.8% 19.5% Japan FAD 1 1 0.0% 0.1% 0.0% Reef/ledge 6 42 48 0.5% 3.9% 2.1% Seamount 720 682 1402 60.2% 64.1% 62.0% Total 1197 1064 2261 Inshore recaptures Bigeye Yellowfin Total % Bigeye % Yellowfin % ofTotal Unassociated 8 8 16 12.5% 2.9% 4.7% Log/drifting FAD 8 8 12.5% 0.0% 2.4% Inshore FAD 42 224 266 65.6% 81.5% 78.5% Marine mammal 1 1 0.0% 0.4% 0.3% Seamount 1 1 0.0% 0.4% 0.3% Reef/ledge 6 41 47 9.4% 14.9% 13.9% 64 275 339 (cm FL) Range Mean Median Mode Std Dev Count Bigeye 29 - 133 61.4 58 53 14.31 9328 Yellowfin 20 - 123 58.2 55 48 17.77 8367 X PNG Indonesia 140 E JAPAN CNMI Guam Federated States of Micronesia Palau Minami Tori Shima 160 E Kiribati Nauru Marshall Islands Wake 180 Midway Phoenix Islands Johnston Howland & Baker Palmyra Jarvis 160 W HAWAII Line Islands Johnston B-1 Cross X B-3 B-2 B-4 Johnston B-1 Cross X B-3 B-2 B-4 B-3 B-2 B-4 Cross Johnston B-1 Cross X B-3 B-2 B-4 Johnston B-1 Cross X B-3 B-2 B-4 Johnston B-1 Cross X B-3 B-2 B-4Most recaptures have come from at or near their point of release. A few long distance movements for yellowfin have been noted, particularly for yellowfin from Midway to Japan. A single yellowfin recapture was reported from the Eastern Pacific in Mexico.
Tag returns show a reasonable match between observed and predicted tag recoveries at all
- sites. The tag-
attrition curve for the two species at the Cross Seamount, however, were markedly different. Attrition of yellowfin at Cross Seamount were rapid (max about 200 days) where as bigeye attrition was more gradual (max of 450 days). Estimates
- f
natural mortality for yellowfin and bigeye were highest for the smallest size classes, lowest for the middle size class and rose again for the larger size fish.
Results
Data used Size and site specific tag attrition model Objective function (for parameter estimation) (1) (2) (3) (4)
Cross Seamount Yellowfin tag attrition Cross Seamount Bigeye tag attritionFishing mortality varied greatly between species and across the sites. Fishing mortality
- f bigeye at
Cross Seamount was similar across three size classes where as for yellowfin it was higher for large size classes (note the different size grouping for the two species)
Yellowfin Fishing Mortality Bigeye Fishing Mortality
The transfer rate matrix indicates estimates of transfer between sites. Highest estimates were from releases at offshore weather buoys to the longline (Other) areas. Movement from Cross to Other were relatively high while transfers from
- ffshore to inshore areas
were low
Transfer Rates (per day) between various fishery components, NA = not applicable; ** = no observations and therefore not estimated Cross Seamount attrition ratios (per day)
The estimates of attrition ratios (attrition components as a proportion of the total attrition rate (Z) showed emigration was the most important source of loss from the Cross Seamount for both species. Fishing mortality contributed ~ 12% of the total for
- bigeye. For yellowfin it was ~ 20%. The low
- verall attrition rate of bigeye from Cross
Seamount account for longer residence times compared with the yellowfin. All recaptures ( Red=Yellowfin : Blue=Bigeye ) YF releases from Midway
Of 1608 yellowfin releases from Midway Atoll, 21 recaptures have been received. Some were recaptured in the main Hawaiian islands, while others went west, including 10 reported from Japanese longline, pole-and-line and coastal handline vessels, fishing on a
- FAD. These have been the only recaptures reported from west of
the Dateline or by a foreign fleet.
BE and YF releases from Cross Seamount
Bigeye released from the Cross Seamount have mainly been recaptured on the seamount or offshore weather buoys 2 and 3. With time, more have been recaptured outside the Hawaii EEZ by longline vessels, mainly to the south. Yellowfin recaptures away from the seamount have come mainly from inshore FADs surrounding the main Hawaiian islands.
BE and YF releases from offshore weather buoys
Bigeye recaptures from the NOAA offshore weather buoys have tended to come back from the same or other weather buoys, the Cross Seamount, or from the offshore longline fishery. Yellowfin recaptures away from the weather buoys more often came from inshore FADs.
BE and YF recaptures from the Big Island
A high percentage of all inshore recaptures of both species have been recorded from the “Big Island” of Hawaii, highlighting the importance of the Big Island to Hawaiian tuna and tuna fisheries. Recaptures have come from the coastal FADs, but also from nearshore tuna koas and traditional handline areas.
Cross Seamount and Offshore Weather Buoys
The Offshore Handline fishery of Hawaii uses a mix of handline and troll gear to harvest bigeye and yellowfin on a productive offshore seamount (Cross Seamount at 18°42’N, 158°42’W) and four
- ffshore NOAA weather buoys (NOAA 51001, 51002, 51003, 51004). Catch rates can be high for such
simple gear types, with the majority of landings consisting of juvenile bigeye tuna. These factors have caused a number of conflicts and complaints against the fishery from other user groups, which include: Low quality product and economic yield per recruit, perceived waste of resource; Claims of negative interaction with inshore small-scale fisheries and offshore longline fisheries; Perceived over harvest of juvenile tuna; Gear conflicts with offshore longline gear; Health concerns over poor onboard storage; Market saturation depressing prices.
Cross Seamount Buoy 1 Buoy 2 Buoy 3 Inshore FADs O T H E R O T H E R 165W 163W 161W 159W 157W 155W 153W 14N 16N 18N 20N 22N 24N 26NModel Area
BIGEYE Release Recovery B2 1493 317 B3 326 29 Cross 5371 653 Inshore 160 50 Other 48 TOTAL 7350 1097 YELLOWFIN B1 247 20 B2 260 40 B3 59 9 Cross 3423 635 Inshore 1239 254 Other 12 TOTAL 5228 970 Grand Tot 12578 2067 Bigeye Tuna 1 10 100 1000 100 200 300 400 500 600 700 800 900 Time-at-liberty (days) Recaptures Observed Predicted Yellowfin Tuna 1 10 100 1000 100 200 300 400 500 600 700 800 900 Time-at-liberty (days) Recaptures Observed PredictedSize specific natural mortality
a: Bigeye Tuna 0.000 0.005 0.010 0.015 0.020 0.025 0.030 B2 B3 Cross Inshore Other F (p er d ay ) 40-60 cm 61-80 cm ≥ 81 cm b: Yellowfin Tuna 0.000 0.005 0.010 0.015 0.020 0.025 0.030 B1 B2 B3 Cross Inshore Other F (p er d ay ) 29-45 cm 46-55 cm ≥ 56 cmBIGEYE B2 B3 Cross Inshore Other B2 NA 0.00245 0.00113 0.00752 0.02707 B3 0.00000 NA 0.01111 0.01073 0.03927 Cross 0.00045 0.00026 NA 0.00464 0.01057 Inshore ** ** 0.00375 NA ** Other ** ** ** ** NA YELLOWFIN B1 B2 B3 Cross Inshore Other B1 NA ** ** 0.00648 0.01055 0.04935 B2 ** NA 0.04301 0.00217 0.00000 0.00024 B3 ** 0.00036 NA 0.00205 0.00101 ** Cross ** 0.00226 ** NA 0.00136 0.02051 Inshore 0.00042 0.00069 ** 0.00000 NA 0.00703 Other ** ** ** ** ** NA Size Class M/Z F/Z E/Z Z/Z Bigeye Tuna 40-50 cm 0.24 0.10 0.66 1.00 61-80 cm 0.16 0.13 0.71 1.00 > 80 cm 0.09 0.13 0.78 1.00 Yellowfin Tuna 29-45 cm 0.35 0.07 0.59 1.00 46-55 cm 0.06 0.30 0.64 1.00 > 52 cm 0.10 0.20 0.70 1.00
Johnston X 25 N Kure Midway 30 N Salmon Bank 15 N 170 W 20 N 175 W 180 Pearl & Hermes Lisianski Laysan Maro Reef Gardner PinnaclesNorthwest Hawaiian Islands
French Frigate Shoals Necker I Nihoa I 160 W 165 W Kaula RockB-3 B-1 Inshore FAD
155 W Cross SeamountB-2 B-4 Isolated reef or atoll Main Hawaiian Islands NOAA weather buoy
Discussion and recommendations
The majority of recaptures came from tuna schools found in association with seamounts, FADs and natural aggregation areas close to the main islands (koas, banks), highlighting the importance of aggregation to the vulnerability of tuna.
- Analyses to date have concentrated on seamount aggregations. Comparative studies using electronic tags may be
necessary to investigate finer scale habitat preferences and to address FAD and koa issues.
- Estimates of residence times, transfer rates and fine scale movements of tuna should be further refined, using
fishery independent means where practical. Yellowfin were found to be highly vulnerable on the Cross Seamount, yet make up a small portion of total landings (~20%) from the fishery in comparison to bigeye. However, data describing landings from the Cross Seamount fishery record yellowfin as the main component of the catch. Data problems clearly exist.
- Species-specific catch and effort data from this fishery needs to be improved.
Yellowfin appear to be more “island associated”, with greater numbers of recaptures reported from inshore FADs and koas in comparison to bigeye. However, this may be due to a higher vulnerability of yellowfin to inshore fisheries and gear types. If bigeye move to inshore waters after leaving the seamount, their presence may be difficult to detect by existing fisheries.
- Research on the role of the physical environment (Hawaiian Islands, seamounts, currents) to the life history of
local pelagic species should be supported. Cross Seamount bigeye recruit to the offshore longline fishery and presumably to spawning areas to the south of
- Hawaii. However, release numbers are likely to be inadequate to resolve these issues.
- Research on the link between pelagic resources of mid-latitude regions, such as Hawaii, and equatorial areas should
be developed. Low exchange rates between the Cross Seamount fishery and inshore areas suggest that current exploitation levels
- ffshore are of minor management concern. However, bigeye catches on the seamount are considered moderate and
are likely to be under-reported due to some non-reporting and mis-recording of bigeye as yellowfin.
- Due to the importance of bigeye to the Hawaii longline fishery and their vulnerability to simple gear types on
seamounts and FADs, the offshore handline fishery should be closely monitored.
- However, further discussions of local management should focus on social and economic considerations related to
the various user groups and fisheries. The importance of improved local catch and effort monitoring can only be reinforced by increasing international concern expressed toward the spawning stock condition of central and western Pacific bigeye, .… which are most likely the source of recruits to Hawaii’s seamount and pelagic longline fisheries for bigeye tuna.
- Hawaii’s situation, representative of a mid-latitude “fringe” fishery for tropical tunas has important relevance to
- ther regions of the western and central Pacific.
SUMMARY
Fishing mortality estimates indicate yellowfin are highly vulnerable at the seamount although bigeye make up the majority of the commercial catch Residence time estimates of bigeye on the Cross Seamount are twice that for yellowfin. Natural mortality estimates for both species were highest for the smaller size classes, decreased for the medium sizes and rose for the larger size classes Transfer rate estimates from offshore FADs and Cross Seamount to inshore areas were low Transfer rate estimates from offshore FADs and the Cross Seamount to the offshore longline fishery were relatively high Exploitation rates at the Cross Seamount are moderate at 10% to 30% of total attrition for both species Emigration is the major source of losses of both species from the Cross Seamount The majority of yellowfin and bigeye tagged by the project correspond to one year old fish. The majority
- f recaptures over the next two or three years
remained relatively close to their point of release
b: Yellowfin Tuna 0.000 0.004 0.008 0.012 0.016 0.020 29-45 cm 46 -55 cm > 56 cm M (per day) a: Bigeye Tuna 0.000 0.002 0.003 0.005 0.006 0.008 0.009 40-60 cm 61-80 cm > 81 cm M (per day)The subscripts i and j (i, j = 1,2…,n) indicates release and recapture sites and k is the release cohort stratified over 1 cm size classes. The tag attrition model (1) partitions the rate of loss of tagged fish into fishing mortality F, natural mortality M, tag shedding rate λ, and the transfer rate T. M and F were specified as functions of release size lk and and time t. The growth of the cohorts in the model was calculated from von Bertalanffy growth function (2) where K, Linfty and t0 are model parameters. Tag shedding parameters α (so called Type-I shedding) and lambda (the instantaneous tag shedding rate) were estimated from double tagging data. The recapture rate (3) of the tagged fish were assumed to be proportional to the total number of tagged fish available in the time period; the proportionality constant being the fishing mortality rate. The size-specific attrition rates were constrained to estimate only for three-size classes. The estimate of the parameters were the values which maximized the Poisson likelihood function (4), obtained my minimizing the negative log of the function.
PNG Indonesia Australia JAPAN 140 E CNMI Guam Federated States of Micronesia Palau Minami Tori Shima 160 E New Caledonia Kiribati Nauru Vanuatu Solomon Islands 180 Marshall Islands Wake Fiji W&F Tonga Samoa Tuvalu Phoenix Islands Tokelau Johnston Howland & Baker Palmyra Jarvis 160 W Am Samoa Niue Cook Islands Line Islands French Polynesia Pitcairn 10 S HAWAII 140 W 10 N USA 30 N Mexico 20 N