
SLIDE 1
FAIRMODE technical meeting, 27-29 June 2016
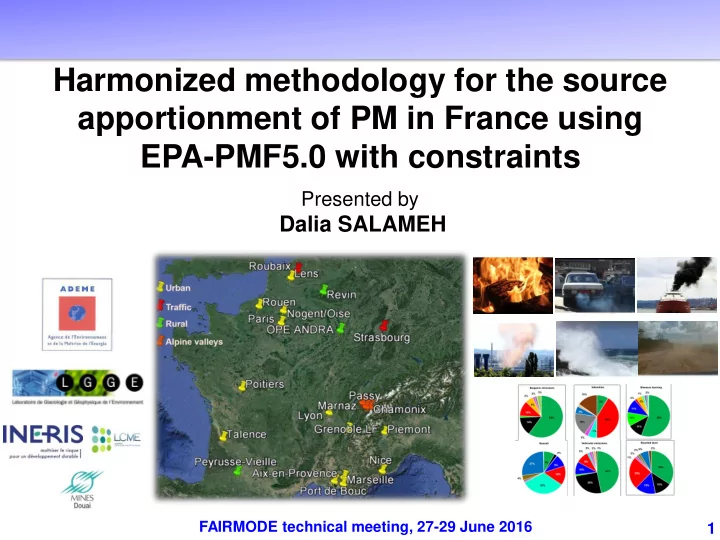
Harmonized methodology for the source apportionment of PM in France using EPA-PMF5.0 with constraints
1
Harmonized methodology for the source apportionment of PM in France - - PowerPoint PPT Presentation
Harmonized methodology for the source apportionment of PM in France using EPA-PMF5.0 with constraints Presented by Dalia SALAMEH FAIRMODE technical meeting, 27-29 June 2016 1 Outlines Presentation of the SOURCES project Context,
FAIRMODE technical meeting, 27-29 June 2016
1
FAIRMODE technical meeting, 27-29 June 2016
2
FAIRMODE technical meeting, 27-29 June 2016
3
PM sampling sites (n=20):
Generally, 24h PM samples were collected every third day (at least 120 filters/year) Detailed PM chemical speciation:
2-, Na+, NH4 +, K+, Mg2+, Ca2+)
Co, Cu, La, Mn, Mo, Ni, Pb, Rb, Sb, Sr, V)
mannosan, galactosan, arabitol, mannitol, sorbitol, MSA, oxalate
FAIRMODE technical meeting, 27-29 June 2016
4
EC, ions, metals, and organic markers) established at various urban environments in France:
profiles based on external knowledge:
with air mass back trajectories)
sites into SPECIEUROPE database
FAIRMODE technical meeting, 27-29 June 2016
5
+, NO3
2-, Cl-, Na+, K+, Mg2+)
FAIRMODE technical meeting, 27-29 June 2016
6
FAIRMODE technical meeting, 27-29 June 2016
7
FAIRMODE technical meeting, 27-29 June 2016
8
Signal-to-Noise (S/N) ratios Variation of Qtrue-to-Qrobust ratios Coefficients of determination (R2) Bootstrap and DISP results Interpretability of the obtained factor profiles Distribution of scaled residuals
FAIRMODE technical meeting, 27-29 June 2016
9
FAIRMODE technical meeting, 27-29 June 2016
10
Minimum set of specific and plausible chemical constraints imposed to elements in factor profiles mostly identified in recent PMF studies in France
(e.g. CAMERA, Part’Aera, Decombio, etc.,)
FAIRMODE technical meeting, 27-29 June 2016
11
100 80 60 40 20 % of species PM10 OC* EC Cl NO3 SO4 NH4 Ba Cu Mo Ni Pb Rb Sb Sr V Zn Al Ca Fe K Mg Na Ti BaA BghiP IP Levoglucosan mannosan Norhopane Hopane S-Homohopane R-Homohopane C29 C31 C33 sum Polyols
Constrained run Base run
Biogenic emissions
Minimum set of specific and plausible chemical constraints imposed to elements in factor profiles mostly identified in recent PMF studies in France
(e.g. CAMERA, Part’Aera, Decombio, etc.,)
Sampling site: Lens (2011-2012), IE
Biogenic emissions factor: Constrained vs. base run
FAIRMODE technical meeting, 27-29 June 2016
12
(1996):
→→ 2% of OC on avg.
with PSI) MBTCA: 3-methyl-1,2,3-butanetricarboxylic acid
markers such as pinonic and pinic acid
the newly formed SOA mass (experimental yield about 0.6 %)
(Sato et al., 2016, AE)
SMNC = methyl-nitrocatechol isomers
Alpine valleys:
FAIRMODE technical meeting, 27-29 June 2016
13
FAIRMODE technical meeting, 27-29 June 2016
14
(90% of NH4+
agr); biomass (70% of NH4+ bio); and Industry/traffic (50% of NH4+ veh mass)
NH4+
veh
NH4+
agr
NH4+
bio
FAIRMODE technical meeting, 27-29 June 2016
15
Chamonix, Alpine site, 2013-2014 Use of BCff and BCwb variables instead of EC Bonvalot et al. (2016), ACPD Relevant geochemical distribution
TCNF values against levoglucosan PhD F Chevrier (LCME, LGGE) High correlation coefficients for Passy (0.995) and Chamonix (0.989) Non fossil fraction represents between 80-90% of total carbon for winter samples ↔↔ dominance of biomass burning Coupling 14C with ME-2 (PhD A Sylvestre, LCE Marseille) Passy and Chamonix, Alpine sites, winter
FAIRMODE technical meeting, 27-29 June 2016
16
Waked et al. (2014), ACP
FAIRMODE technical meeting, 27-29 June 2016
Calas et al., 2016 (in prep)
17
Results from Passy (A-cellular assays; ascorbate acid depletion (AA))
FAIRMODE technical meeting, 27-29 June 2016
18
Uncertainty estimation method Constrained PMF methodology Analysis of new tracers Source profiles into SPECIEUROPE N isotopes
Determination of a standard and harmonized methodology for quantifying PM sources at different urban French environments using EPA-PMF5.0 with constraints
20 sites (min. 1year of data) Air mass back trajectories Radiocarbon 14C Online AE-33 Oxidative potential (OP)
SOURCES project In progress
FAIRMODE technical meeting, 27-29 June 2016
19
FAIRMODE technical meeting, 27-29 June 2016
20
Dalia SALAMEH (dalia.salameh@lgge.obs.ujf-grenoble.fr) Jean Luc JAFFREZO (jaffrezo@lgge.obs.ujf-grenoble.fr) Olivier FAVEZ (Olivier.FAVEZ@ineris.fr)