
SLIDE 1
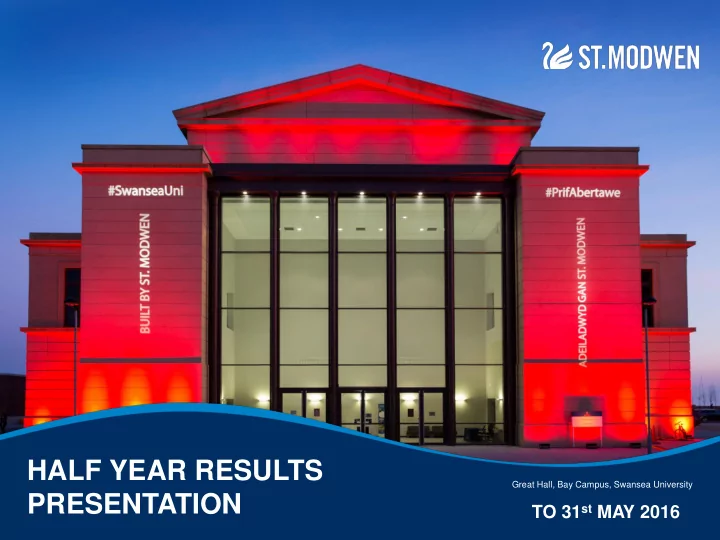
HALF YEAR RESULTS PRESENTATION
TO 31st MAY 2016
Great Hall, Bay Campus, Swansea University
HALF YEAR RESULTS Great Hall, Bay Campus, Swansea University - - PowerPoint PPT Presentation
HALF YEAR RESULTS Great Hall, Bay Campus, Swansea University PRESENTATION TO 31 st MAY 2016 DISCLAIMER This presentation does not contain or constitute an invitation or inducement to any person to underwrite, subscribe for, or otherwise acquire
TO 31st MAY 2016
Great Hall, Bay Campus, Swansea University
This presentation does not contain or constitute an invitation or inducement to any person to underwrite, subscribe for, or otherwise acquire or dispose of any shares in St. Modwen Properties PLC or other securities and should not be relied on for such purposes. This presentation may contain certain forward looking statements. By their nature, forward looking statements involve risk and uncertainty because they relate to future events and circumstances. Actual outcomes and results may differ materially from any outcomes or results expressed or implied by such forward looking statements. Any forward looking statements made by or on behalf of St. Modwen Properties PLC speak only as of the date they are made and no representation or warranty is given in relation to them, including as to their completeness or accuracy or the basis on which they were prepared. St. Modwen Properties PLC does not undertake to update forward looking statements to reflect any changes in St. Modwen Properties PLC's expectations with regard thereto or any changes in events, conditions or circumstances on which any such statement is based. Statements are made in this presentation about the price and past performance of shares in St. Modwen Properties PLC. Past performance cannot be relied upon as a guide to future performance.
3
Chief Executive
Group Finance Director
Highlights 4 Operational Overview 5 Financial Results 13 Outlook 22 Appendices 23
4
PERFORMANCE AND OPERATIONS
profits of £36m (H1 2015: £37m)
by good sales rates across the UK
potential for long-term development opportunities
STRONG RESULTS DRIVEN BY ROBUST UNDERLYING PERFORMANCE
NCGM under construction, Nine Elms, London Bay Campus, Swansea University Longbridge, Birmingham
FINANCIAL HIGHLIGHTS
and EPRA NAV up 1% to 451p (Nov 2015: 446p)
valuation gain)
reduction from NCGM re-valuation
5
Access 18, Avonmouth
6
through our own actions
CONTINUALLY PROVIDING OPPORTUNITIES FOR LONG-TERM VALUE CREATION
planning permission already secured, to be delivered over time
identified for future pipeline, subject to planning
recognition*
and St. Modwen Homes
* Allocated in local plan or similar, resolution to grant, outline permission or detailed permission – see slide 41
Commercial land and development £157m 9% Income producing £804m 47% Residential land and development £738m 44%
7
£1.7BN PROPERTY PORTFOLIO DELIVERING STRONG REGIONAL ACTIVITY
North West
Key acquisitions (£4.7m net rental income):
260,000 sq ft industrial estate, Bury, Greater Manchester
South West
Development agreement: £90m development of 1m sq ft industrial park, Chippenham, Wiltshire
North East & Yorkshire
Active development: Over 100,000 sq ft retail and industrial space, Doncaster (£11m GDV)
Midlands
Active development: Over 450,000 sq ft across four projects, incl. new facilities for Travis Perkins and DFS (£37m GDV)
London & South East
Development agreement: £200m development of Spray Street, Woolwich in 50/50 JV with Notting Hill Housing
South Wales
Active development: Phase 1c Bay Campus, Swansea University, 538 rooms, £2.2m net rental income
Northern Home Counties
Development agreement: 1m sq ft industrial development, part of £900m Stanton Cross regeneration, Wellingborough
8
MAJOR PROJECTS HOLD EXCELLENT POTENTIAL FOR FUTURE VALUE GENERATION
NEW COVENT GARDEN MARKET:
reduction in residential sales prices to £1,276 per sq ft (Nov 2015: £1,325 per sq ft) LONGBRIDGE, BIRMINGHAM:
BAY CAMPUS, SWANSEA UNIVERSITY:
£4.8m
NCGM, Nine Elms, London Longbridge, Birmingham Bay Campus, Swansea University
9
Hilton Valley, Derbyshire
10
RESIDENTIAL BUSINESS DELIVERING ACCELERATED GROWTH
(H1 2015: £13m), supported by growth of St. Modwen Homes
Persimmon
from our own land bank
£200k
2 4 14 15 7 4 5 10 13 8
5 10 15 20 25 30
FY 2012 FY 2013 FY 2014 FY 2015 HY 2016
Persimmon JV
£m
101 239 562 652 259 158 126 258 315 202
100 200 300 400 500 600 700 800 900 1000 FY 2012 FY 2013 FY 2014 FY2015 HY 2016 Units
Residential completions Residential development profits 259 461 967 820 365 15 28 24 9 6
11
BROADENING REACH ACROSS THE UK
12
INCREASED INVESTMENT IN PRS
Completed developments:
Two schemes 64 apartments £0.7m annual rent £15m GDV
Future opportunities:
Nine schemes
*subject to planning 4 5 6
Utilising land bank to deliver both development profits and growth in rental income
Wembley Central (38 apts) Edison Place, Rugby (26 apts) Edison Place Phase 2, Rugby
3 Edmonton Green, Enfield Lee Green, Lewisham Spray Street, Woolwich Farnborough Town Centre, Hampshire Wythenshawe Town Centre, Manchester Longbridge, Birmingham
5 1 9 10 11 6 7 8 2 3 4 1 2 3 5 6 7 11 8 9 10 4
13
Burton Gateway, Burton upon Trent
14
EXCELLENT UNDERLYING TRADING PROFITS DEMONSTRATE THE STRENGTH OF THE BUSINESS
to 451p (Nov 2015: 446p)
valuation, combined reducing NAV and EPRA NAV growth by 4% and 3%, respectively
15
31 May 2016 £m 31 May 2015 £m 30 Nov 2015 £m Net rental income 24.8. 18.6. 38.7. Property profits 36.1. 37.3. 67.4. Other income 2.1. 2.1. 4.2. Overheads (17.0) (12.1) (26.5) Operating profit 46.0. 45.9. 83.8. Interest (11.6) (10.5) (20.5) Trading profit 34.4. 35.4. 63.3. Added value valuation gains 14.9. 28.4. 38.6. Market valuation movement 13.0. 20.4. 35.7. Other finance (income/charges) 1.0. (6.5) (6.6) Underlying profit before all tax 63.3 (-19%) 77.7. 131.0. NCGM valuation movement (20.8).. 128.0... 127.4... SDLT impact (12.5)
30.0 (-85%) 205.7. 258.4. Earnings per share 11.8p 76.0p 97.9p BUSINESS DELIVERS ROBUST PROFITS AGAINST RECORD YEAR IN 2015
NOTE: the above figures are stated on a proportionally consolidated basis, including our share of JVs
16
Significantly improved rent roll now covering more than 100% of business running costs – net rent and other income increased to £27m (H1 2015: £21m) £804m portfolio of income producing assets (47% of total portfolio), with annualised gross rent roll exceeding £60m Stable level of tenant vacations and good level of occupancy at 89% maintained through development Investment properties delivering high yields with an equivalent yield of 7.7% (Nov 2015: 7.7%) on income producing properties Average lease length of 7 years
PROVIDING A FIRM FINANCIAL BASE THAT COVERS BUSINESS RUNNING COSTS
Business running costs restated to exclude direct residential overheads (see appendix, slide 39)
19.8 19.5 20.1 20.7 26.9 39.0 39.2 40.7 42.9
20.0 30.0 40.0 50.0 2012 2013 2014 2015 HY 2016 £m Increasing rent & other Income
HY FY
94% 89% 92% 96% 101% 80% 85% 90% 95% 100% 105% 2012 2013 2014 2015 2016 HY Improving cost coverage 105 100 95 90 85 80 %
17
the regions
growth in St. Modwen Homes
generating added value gains
CONTINUED DELIVERY OF EXCELLENT COMMERCIAL AND RESIDENTIAL PROPERTY PROFITS
Meon Vale, Warwickshire Bay Campus, Swansea University Parkside Business Park, Doncaster
2 9 13 15 6 4 21 21 8 6 3 16 19 37 36
20 30 40 HY 2013 HY 2014 HY 2015 HY 2016 £m Bay Campus, Swansea University Commercial Housebuilding
18
ROBUST BALANCE SHEET DEMONSTRATES STRENGTH OF THE BUSINESS 31 May 2016 £m 30 Nov 2015 £m Property assets 1,311. 1,265. Investments in JVs and other assets 198. 232. Debtors 114. 112. Gross assets 1,623. 1,609. Net borrowings (454) (443) Finance leases (57) (55) Trade payables etc. (173) (189) Gross liabilities (684) (687) Net assets 939. 922. Non-controlling interests (7) (7) Shareholders’ funds 932. 915. NAV per share 421p (+2%) 414p EPRA NAV per share 451p (+1%) 446p
19
Nov 2015 May 2016 NAV per share 414p 421p EPRA NAV per share 446p 451p CONTINUE TO GROW NAV WITH UNDERLYING STRENGTH OF BUSINESS 966 932 (11) (13) (21) 34 15 13 915 700 750 800 850 900 950 1,000 Nov-15 Trading profit Value added gains Market valuation gains Dividend / Tax / Other Subtotal SDLT NCGM May-16 £m
+6% +2%
20
JV facilities: KPI £85m (St. Modwen share 50% of £68m drawn) Expires 2019 VSM Uxbridge £30m (St. Modwen share 50% of £26m drawn) Expires 2019
MATURITIES EXTENDED THROUGH CONTINUED REFINANCING ACTIVITY 100 125 80 100 50 103 457 101 100 200 300 400 500 600 May-16 2016 renewal 2017 renewal 2018 renewal 2019 renewal 2020 renewal 2021 renewal £m
Headroom Borrowings Santander Barclays HSBC Convertible Bond RBS Retail Bond
21
STRONG RESULTS AND RESILIENT BALANCE SHEET
Weighted average debt maturity increased to
Shareholders’ equity NAV per share increased by
(EPRA NAV per share up 1% to 451p)
Resilient balance sheet with see-through LTV at
Weighted average cost
(Nov 2015: 3.9%)
Business running costs fully covered
(Nov 2015: 96%)
Trading profit in line with 2015 record year
(Nov 2015: 3.6 years)
22
BUSINESS REMAINS IN EXCELLENT SHAPE, UNDERPINNED BY STRONG REGIONAL PORTFOLIO
regional commercial and residential development
portfolio whilst recycling assets to which we can no longer add significant value
a more cautious approach to the delivery of our development strategy, albeit the company remains in an exceptionally strong financial position
Celtic Business Park, Newport, Wales DFS, Centurion Park, Tamworth Trentham Manor, Stoke-on-Trent
23
Ivor Goodsite, Meon Vale, Warwickshire
24
25
Our expertise in remediation, planning, asset development and construction supports our strategy of securing excellent returns through a focus on long-term significant added value while protecting our assets
26
Consistent ratio of rental and other income to
interest Property valuation uplifts through active development Delivery of property profits
94 89 92 96 101
20 40 60 80 100 FY 2012 FY 2013 FY 2014 FY 2015 HY 2016
35 18 15 28 15
20 40 60 HY 2012 HY 2013 HY 2014 HY 2015* HY 2016
17 16 19 37 36 20 40
HY 2012 HY 2013 HY 2014 HY 2015 HY 2016
1
HY 2016
* Before £128m benefit from NCGM
27
28
29
JV 8% Wholly
64%
Land bank ownership
Development agreement 28% SMH £87m
Residential land bank
Persimmon JV £22m Under management - Regions £330m Under management – London & SE £299m Developable acres May 2016 Nov 2015 Nov 2014 Retail 335 344 342 Industrial and Commercial 3,109 2,923 2,935 Residential 1,970 2,021 1,954 Not yet specified 766 724 642 Total developable 6,180 6,012 5,873
Within 5 years 15% Within 5- 10 years 20% 10+ years 65%
Development timescales
30
£m Valuation Movement Nov 2015 Additions Reductions SDLT Updated Portfolio Market
Added May 2016 Commercial Land (9%) 152 34 (34) (1) 151 1) 5 157 Income Producing (47%) Industrial 276 23 (6) (3) 290 4) 7 301 Retail 338 11 (8) (3) 338 4) 3 345 Residential 106 10
115 1)
Office 48 2 (8)
Residential Land (44%) 772 133 (144) (5) 756 (18)
1,692 213 (200) (13) 1,692 (8) 15 1,699
31
GOOD ACTIVE AND MARKET VALUATION GAINS BEFORE SDLT AND NCGM IMPACT
FY 2013 FY 2014 FY 2015 HY 2016 Market valuation gains Market valuation gain 14 58 36 13i Stamp Duty Land Tax
New Covent Garden Market
Reported market valuation gain 14 58 36 (21) Added value valuation gains Residential land 6 19 17
Income producing and commercial land 22 17 22 15. New Covent Garden Market
Reported added value valuation gains 28 36 166 15i
32
31 May 2016 30 Nov 2015
Acres Plots Acres Plots With planning recognition
103 1,768 107 1,963
99 1,236 123 1,736
1,107 20,301 1,104 19,829
182 2,862 161 2,498 1,491 26,167 1,495 26,026 No planning recognition
88 1,688 186 2,236
391 4,417 340 4,254 TOTAL RESIDENTIAL LAND* 1,970 32,272 2,021 32,516
*Includes 100% of JV's
33
40% DELIVERED TO DATE AND £XM VALUE GENERATED
34
adjacent to new Nine Elms tube station
capital outlay to date
A CLASSIC ST. MODWEN LONG-TERM REGENERATION PROJECT
Development agreement unconditional Procurement of new 500,000 sq ft market commenced Handover of temporary flower market Nine Elms Square (10 acres) – vacant possession Nine Elms Gardens – vacant possession Nine Elms Grove – vacant possession April 2015 July 2015 2017 2017 2022 2022 2022 New market completion
35
was given to the revenue streams associated with the first two phases of student accommodation at the Bay Campus development for Swansea University.
payments to M&G, meaning that the Group retains exposure (both positive and negative) to all variability in net rentals generated from the properties, it was concluded that the transaction was more appropriately accounted for as a finance lease arrangement, rather than as the sale of 50%
Balance Sheet as reported in the Financial Statements for that period. This restatement has now also been applied to the results for the six months ended 31st May 2015 to reflect recognition by the Group of the elements below: − the whole (rather than 50%) of the property interest in the student accommodation; − to account for the amounts due to M&G as a finance lease liability; − to eliminate the construction contract accounting recognised in respect of the proportion of the development work performed on these sites that was funded by M&G; and − to revalue the site during the course of construction.
36
31 May 2015
£m unless otherwise stated Previously reported Restated Swansea Movement Profit before all tax 203.1 205.7 2.6 Basic EPS 75.4p 76.0p 0.6p Property portfolio 1,528.7 1,580.4 51.7 Net assets 876.7 878.3 1.6 EPRA NAV per share 427p 428p 1p Net borrowing 383.6 431.0 47.4 Gearing 44% 49% 5% See-through LTV 29% 31% 2%
37
31 May 2016 £m 31 May 2015 £m
House building Land & Comm. Property Total House building Land & Comm. Property Total Net rental income 24.8 24.8
i18.6 Property profits 15.0 21.1 36.1 12.8 24.5 i37.3 Other income iz2.1 zi2.1
iz2.1 Overheads n(4.5) (12.5) (17.0) z(2.7) (9.4) (12.1) Operating profit 10.5 35.5 46.0 10.1 35.8 i45.9 Interest b(0.8) (10.8) (11.6) (0.8) i(9.7) (10.5) Trading profit 9.7 24.7 34.4 z9.3 26.1 i35.4 Added value property valuation gain 14.9 z28.4 NCGM valuation movement (20.8) 128.0 Market property valuation movement 13.0 z20.4 SDLT (12.5)
zi1.0 z(6.5) Profit before all tax 30.0 205.7
38
£m FY 2012 FY 2013 FY 2014 FY 2015 H1 2016 Net rental income 36.2 36.3 37.1 38.7 24.8 Other income 2.8 2.9 3.6 4.2 2.1 Income producing portfolio 39.0 39.2 40.7 42.9 26.9 Group overheads 18.6 20.2 23.2 26.5 17.0 Less direct residential costs* (1.2) (1.9) (2.0) (2.4) (1.9) Adjusted Group overheads 17.4 18.3 21.2 24.1 15.1 Interest 23.9 25.5 23.1 20.5 11.6 Business running cost 41.3 43.8 44.3 44.6 26.7 Cost coverage % 94% 89% 92% 96% 101%
*Direct residential costs are the total employee costs for dedicated residential employees only and exclude any allocation of Group resources
39
£m* Alstom Group UK Ltd 4.0 Swansea University 2.7 Shanghai Automotive 1.7 Marks & Spencer 1.5 Knorr Bremse SFS 1.5 Paragon Automotive Services Ltd 1.4 Beko PLC 1.1 Arlington Fleet and Retail Group 1.0 Siemens Industrial Turbomachinery Ltd 1.0 Wireless Data Services 0.8
* Gross annual rent before minority interest or joint venture accounting
Top 10 of 1,700+ tenants across the portfolio, representing a third of Group income
40
31 May 2016 30 Nov 2015
£m £m Rent roll at start of period / year 58.4 45.4 Acquisitions / (disposals) (0.2) 2.4 58.2 47.8 Tenant vacations (2.7) (4.0) Tenant administrations
Rent reviews 1.8 1.7 New lettings 5.2 13.1 Closing rent roll 62.5 58.4 Void percentage 11% 11%
87 88 89 89 89
10 20 30 40 50 60 70 80 90 100 FY 2012 FY 2013 FY 2014 FY 2015 HY 2016
%
Occupancy Rates
1
HY 2016
41
Yield Analysis (including Group share of JVs) Equivalent Net initial 31 May 2016 30 Nov 2015 31 May 2016 30 Nov 2015 Retail 7.4% 7.6% 6.1% 6.1% Office 9.3% 8.9% 7.4% 6.6% Residential 4.6% 5.0% 4.6% 5.0% Industrial 8.4% 8.4% 8.3% 7.3% Portfolio 7.4% 7.7% 6.6% 6.5%
42
NET BORROWINGS MAINTAINED IN THE PERIOD THROUGH BALANCED ACQUISITIONS AND DISPOSALS (454) 24 1 3 200 (26) (213) (443)
300 350 400 450 500 550 600 650 700 Nov 2015 Net rents &
Overheads & interest Tax & net dividends Working capital & finance leases Acquisitions & development Disposals May 2016
£m
43
AMPLE RESOURCES AND HEADROOM TO FUND SIGNIFICANT DEVELOPMENT PIPELINE
4.8% 4.4% 3.9% 3.8% 2.0% 2.5% 3.0% 3.5% 4.0% 4.5% 5.0% Nov 2014 May 2015 Nov 2015 May 2016
Weighted average interest rate
4.6 4.1 3.6 3.7 2.0 2.5 3.0 3.5 4.0 4.5 5.0 Nov 2014 May 2015 Nov 2015 May 2016
Average facility maturity
years
31% 31% 30% 30% 30% 30% 31% 31% 32% Nov 2014 May 2015 Nov 2015 May 2016
See-through LTV
47% 44% 48% 48% 42% 43% 44% 45% 46% 47% 48% 49% Nov 2014 May 2015 Nov 2015 May 2016
Adjusted gearing
43
Description Covenant Actual
31 May 2016 Net assets >£250m £939m Gearing <175% 54% See-through interest cover ratio >1.25x 3.9x See-through loan to value <65% 30%
* excludes non-cash items such as revaluation movements
45
£m unless stated otherwise FY 2012 FY 2013 FY 2014 FY 2015 31 May 2016 Rental and other income 39.0) 39.2) 40.7) 42.9) 26.9) Property profits 29.0) 39.8) 51.3) 67.4) 36.1) Overheads (18.6) (20.2) (23.2) (26.5) (17.0) Interest (23.9) (25.5) (23.1) (20.5) (11.6) Trading profit (before revaluation movements) 25.5) 33.3) 45.7) 63.3) 34.4) Property portfolio (exc. assets under finance leases) 1,098.2) 1,141.8) 1,244.0) 1,638.5) 1,641.5) See-through net borrowings 448.7) 367.9) 380.2) 489.3) 500.6) See-through LTV 41% 33% 31% 30% 30% Net assets 513.7) 616.6) 724.0) 921.5) 939.4)
43
component of property revaluations delivered as a direct result of management actions and initiatives e.g. obtaining planning consent, achieving remediation milestones and improving lease terms
borrowings (at amortised cost and excluding finance leases) to net assets
rental and other income to operating costs
sale value of property after construction
mark-to-market of derivative financial instruments and other non-cash items) for the Group (including its share of joint ventures and associates)
income to interest
with joint ventures and associates
(excluding finance leases at amortised cost) less cash and cash equivalents
leases) less cash and cash equivalents
receivable less non-recoverable property costs for the Group (including its share of joint ventures and associates)
(ERV) attributable to vacant units as a proportion of total ERV (including the Group’s share of joint ventures and associates). ERV is determined by the Group’s external valuers
costs: Administrative expenses plus net finance costs (excluding the mark-to-market
non-cash items) for the Group (including its share of joint ventures and associates)
generated from the operating assets of the Group (including its share of joint ventures and associates)
property profits and other income for the Group (including its share of joint ventures and associates)
arrangement with Persimmon to develop residential units on agreed sites within the
and inventories of the Group (including its share of joint ventures and associates) comprising income producing properties together with residential and commercial land
(before the deduction of net realisable value provisions) plus gains on disposals of investments/ investment properties for the Group (including its share of joint ventures and associates)
average lease term to the first tenant break
a proportional consolidated basis (including Group share of joint venture and associates)