
SLIDE 1
Growth in Vehicle Ownership and Per-Capita Income: Germany, Japan, - - PowerPoint PPT Presentation
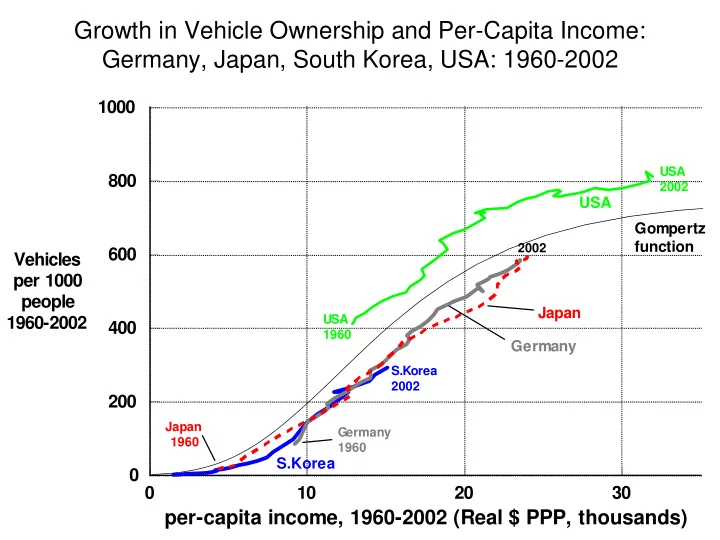
Growth in Vehicle Ownership and Per-Capita Income: Germany, Japan, South Korea, USA: 1960-2002 1000 USA 800 2002 USA Gompertz function 2002 600 Vehicles per 1000 people Japan USA 1960-2002 400 1960 Germany S.Korea 2002 200
2 3 4 5 6 7 8 9 10 20 30 40 50 60
GDP per-capita: historical & projected
10 20 30 40 50 60 70 80 90 100 200 300 400 500 600 700 800 900 1000
Vehicles per 1000 people: historical & projected
USA 2030
India 2030 Korea 1982 China 2002 China 2030
Brazil 1962 Mexico 1960 Japan 1960
Brazil 2002 Mexico 2002 USA 1960
USA 2002 Korea 2030 Japan 2030 Japan '02
India 2002 Brazil 2030 Spain 1960 Spain 2002
Spain 2030
Korea 2002 Mexico 2030