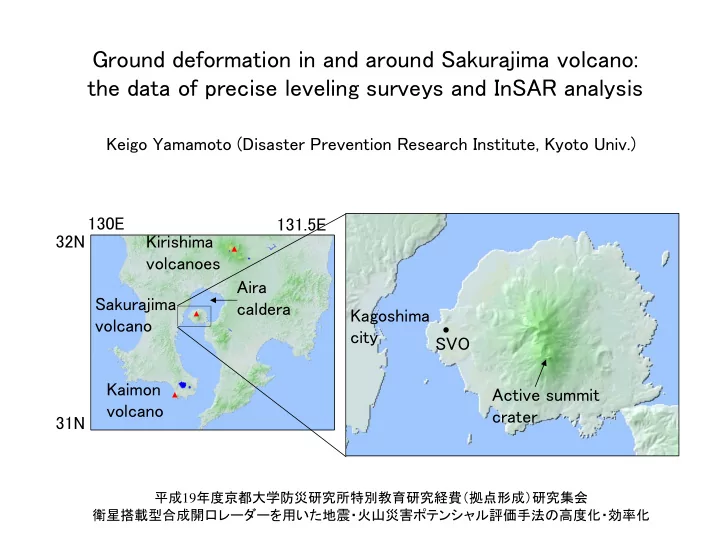
SLIDE 1 Ground deformation in and around Sakurajima volcano: the data of precise leveling surveys and InSAR analysis
Keigo Yamamoto (Disaster Prevention Research Institute, Kyoto Univ.)
平成19年度京都大学防災研究所特別教育研究経費(拠点形成)研究集会 衛星搭載型合成開口レーダーを用いた地震・火山災害ポテンシャル評価手法の高度化・効率化
Kagoshima city Active summit crater SVO 130E 131.5E 32N 31N Sakurajima volcano Kaimon volcano Aira caldera Kirishima volcanoes
SLIDE 2 Explosive eruption at the active summit crater
SLIDE 3
1000 2000 3000 4000 1955 1960 1965 1970 1975 1980 1985 1990 1995 2000 2005
(104tons) Yearly weights of estimated ash-fall deposits
Observation Start 100 200 300 400 500 600 1955 1960 1965 1970 1975 1980 1985 1990 1995 2000 2005
(Number) Yearly number of explosive eruptions
Eruptive activities at the active summit crater of Sakurajima volcano since 1955
SLIDE 4
Typical ground deformation patterns of Sakurajima volcano
Inactive stage of summit eruption:
inflation beneath Aira caldera (about 25cm uplift around northern part of Sakurajima) → magma storage at the reservoir beneath Aira caldera
Active stage of summit eruption:
deflation beneath Aira caldera and Sakurajima (about 23cm subsidence around northern and central part of Sakurajima) → pressure decrease at the reservoirs beneath Aira caldera and Sakurajima due to excess magma ejection (after Eto et al., 1997)
SLIDE 5 1000 2000 3000 4000 1955 1960 1965 1970 1975 1980 1985 1990 1995 2000 2005
(104tons) Yearly weights of estimated ash-fall deposits
Observation Start 100 200 300 400 500 600 1955 1960 1965 1970 1975 1980 1985 1990 1995 2000 2005
(Number) Yearly number of explosive eruptions
Relations among secular changes of relative heights of BMs and eruptive activities at the active crater of Sakurajima volcano
Minamidake crater
S17 S26
2km
BMSVO 1.40 1.50 1.60 1.70 1.80
1955 1960 1965 1970 1975 1980 1985 1990 1995 2000 2005
(m) Relative height of BM-S26 referred to BM-S17 (Caldera uplift) 405.20 405.30 405.40 405.50 405.60 BMSVO
SLIDE 6
(after Okuyama et al., 2001)
InSAR results by using JERS-1 data
9401 | 9703 9508 | 9808
SLIDE 7
Leveling survey 2007
Observation period: 2007/10/01-11/06 (Geographical Survey Institute) 2007/12/03-12/11 (University group)
(km) (km)
Leveling bench marks
SLIDE 8
0.0 5.0 10.0 0.0 10.0 20.0 30.0 40.0 50.0 Distance from S17 (km) Vertical displacement (mm)
Sakurajima North Coast Sakurajima South Coast Sakurajima Western Flank Aira Caldera East Coast
0.0 5.0 10.0 0.0 10.0
Vertical displacement
Data: 2006/06, 09 ~ 2007/10-12 (University and GSI data) Reference bench mark: S.17
SLIDE 9
Pressure source (Mogi’s model)
Distance from pressure source (km) Vertical displacement (mm) Pressure source location is shown by the solid circle. Contours are the correlation coefficients between data and theoretical curve at the depth of 14.6km.
(km)
Depth = 14.6 km Vertical displacement above the pressure source: +19.1 mm Deformation volume at the pressure source: +1.7×10⁷ m3 Correlation coefficient: 0.940
(km)
SLIDE 10
Data Master: 2007/11/12 Slave: 2006/09/24 ( ← nearly leveling period) FBS mode Ascending Off nadir angle: 34.3 deg. Bperp ~ -1700 m
ALOS/PALSAR interferogram
SLIDE 11
↓ Average pixels in 500m × 500m area: Area 1 = -1.51 cm Area 2 = -0.19 cm ↓ This preliminary result is consistent with the Mogi’s model calculation. Area 1 Area 2 Expected InSAR image calculated by using the pressure source from leveling data.
SLIDE 12
Summary
We conducted the precise leveling survey in Sakurajima volcano and around the Aira caldera during the period from October to December 2007. The last survey had been conducted in June and September 2006. The obtained survey data indicate the ground uplifts at the northern part of Sakurajima during the period from 2006 to 2007. From the analysis according to Mogi’s the model, the inflation source is located beneath the northern flank of the volcano, suggesting that the magma storage at the deep magma reservoir is progressed during the study period. ALOS/PALSAR image pair is selected to analyze so as to compare the ground deformation with that from the leveling data analysis. The resultant interferogram is seem to be consistent with the theoretical one that is calculated by using Mogi’s source, although the ground deformation is minor during this study period.
Acknowledgement: PALSAR level 1.0 data are shared among PIXEL (Palsar Interferometry Consortium to Study our Evolving Land surface), and providing from JAXA under a cooperative research contract with ERI, Univ, Tokyo. The ownership of PALSAR data belongs to METI and JAXA.