
SLIDE 1
- GREEN. INTELLIGENT. GLOBAL
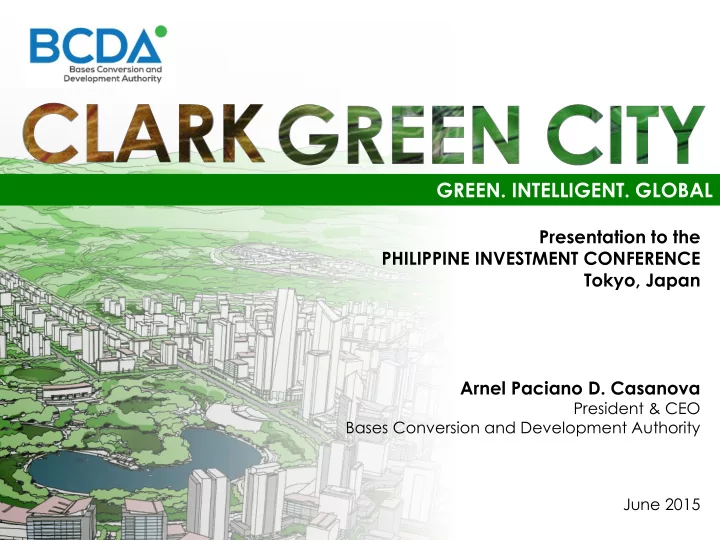
Presentation to the PHILIPPINE INVESTMENT CONFERENCE Tokyo, Japan Arnel Paciano D. Casanova
President & CEO Bases Conversion and Development Authority June 2015
GREEN. INTELLIGENT. GLOBAL Presentation to the PHILIPPINE - - PowerPoint PPT Presentation
GREEN. INTELLIGENT. GLOBAL Presentation to the PHILIPPINE INVESTMENT CONFERENCE Tokyo, Japan Arnel Paciano D. Casanova President & CEO Bases Conversion and Development Authority June 2015 THE PHILIPPINES: LEGEND: 4-HR FLIGHT ROUTE
Presentation to the PHILIPPINE INVESTMENT CONFERENCE Tokyo, Japan Arnel Paciano D. Casanova
President & CEO Bases Conversion and Development Authority June 2015
Image Credit: Palafox Associates
2 4 6 8 Bangladesh Bhutan Brunei Cambodia China Australia Guam Hongkong India Indonesia Japan Laos Malaysia Maldives Micronesia Mongolia Myanmar Nauru Nepal North Korea Pakistan Palau Papua New Guinea Saipan Singapore Solomon Islands South Korea Sri Lanka Taiwan Thailand Timor Leste Vietnam
4-HR FLIGHT ROUTE 6-HR FLIGHT ROUTE 4-HR FLIGHT RADIUS 6-HR FLIGHT RADIUS
LEGEND:
Hours of Travel
STRATEGICALLY LOCATED AT THE CROSSROADS OF INTERNATIONAL SHIPPING AND AIRLINES.
LESS THAN 10 DAYS TRAVEL MORE THAN 10 DAYS TRAVEL LESS THAN 10 DAYS TRAVEL MORE THAN 10 DAYS TRAVEL
LEGEND:
STRATEGICALLY LOCATED AT THE CROSSROADS OF INTERNATIONAL SHIPPING AND AIRLINES.
Image Credit: Palafox Associates
Port Country Travel Time
Tokyo Japan 10 d Yokohama Japan 10 d Kobe Japan 10 d Hong Kong Hong Kong 2 d Shanghai PRC 3 d Tianjin PRC 10 d Shenzhen PRC 2 d Singapore Singapore 10 d Incheon
9 d Kaohsiung Taiwan 2 d Ho Chi Minh Vietnam 3 d Penang Malaysia 13 d Jakarta Indonesia 12 d Alotau
Guinea 15 d Galle Sri Lanka 19 d
Accelerate the conversion
and their extensions into alternative productive uses.
Raise funds
through the sale of Metro Manila Camps to finance the conversion of former US military bases.
Enhance the benefits
development of Central Luzon, in particular, and the country, in general.
To construct, own, lease, operate and maintain public utilities as well as infrastructure facilities. To acquire, own, hold, administer, and lease real and personal properties, including agricultural lands, property lands, property rights and interests and encumber, lease, mortgage, sell, alienate or
may deem appropriate. To exercise the right of eminent domain and
6
Prime Real Estate 41,500 Has. Asset Value USD 10 Billion Public-Private Partnerships 1 Tollway 2 Seaports 3 Airports Major Real Estate Developments Fiscal & Non-Fiscal Incentives Preferential tax rates Zero VAT Exemptions on Real Property Tax
Public-Private Partnerships Bonifacio Global City
LAND AREA 240 HAS. LOCATION TAGUIG CITY, METRO MANILA JV PARTNER FORT BONIFACIO DEVELOPMENT CORPORATION TOTAL GFA 12.1 M DEVELOPMENT INVESTMENT PHP 250 B
The BEST MASTER PLANNED urban center in the country
MAP
Public-Private Partnerships McKinley Hill, Newport City and
McKinley West
Special Economic Zone
(27,000 hectares)
Special Economic
and Freeport Zone (31,400 hectares)
Freeport Zone
(4,400 hectares)
Airport Area
(2,300 has)
Industrial Area
(2,100 has)
Clark’s Thriving Business Center
QUICK STATS
(2014)
LOCATORS
EMPLOYEES
EXPORTS
TOURISTS
INVESTMENT
Special Economic Zones Clark Freeport & SEZ
MAIN ZONE 4,400 HAS. SUB-ZONE 27,000 HAS. LOCATION PAMPANGA & TARLAC ADMINISTRATOR CLARK DEVELOPMENT CORPORATION (FREEPORT); CLARK INTERNATIONAL AIRPORT CORPORATION (AIRPORT)
740
Special Economic Zones Bataan Tech Park
LAND AREA 365 HAS. LOCATION MORONG, BATAAN LOCATOR ATMANDA ECOPARK
Special Economic Zones Poro Point Freeport Zone
LAND AREA 236 HAS. LOCATION CITY OF SAN FERNANDO, LA UNION ADMINISTRATOR PORO POINT MANAGEMENT CORPORATION DEVELOPMENT INVESTMENT PHP 250 B
Special Economic Zones Camp John Hay SEZ
LAND AREA 625 HAS. LOCATION BAGUIO CITY ADMINISTRATOR JOHN HAY MAANGEMENT CORPORATION
LOCATORS 110
Infrastructure Development Subic-Clark-Tarlac Expressway
Japan International Cooperation Agency (JICA) Funded
PROJECT COST USD 600 M. ANNUAL REVENUE PHP 1.2 B
Japanese Contractors:
16
Clark Green City The Agricultural Heartland
Dagupan City Urdaneta City Cabanatuan City San Carlos City San Jose City Gapan City Angeles City Olongapo City Malolos City Balanga City
METRO MANILA
Baguio City Alaminos City Iba San Fernando City
SCTEX
CLARK GREEN CITY
TPLEX
CAPAS-BOTOLAN RD.
CLEX
Mabalacat
NLEX
Concepcion Lingayen
18
Tarlac City Rosario Capas
MNR
Economic Drivers and Trends
doing business in Clark
(BPO) Industry
Infrastructure Development
sustain momentum in economic growth
Clark Green City The New Ph Metropolis
Clark Green City Conceptual Master Plan
The 9,450-hectare Clark Green City aims to create a destination where nature, lifestyle, business, education and industry converge into a global city, based on principles of sustainability, that aim to protect and enhance the delicate balance between nature and built environment.
INTERWEAVING GREEN ASSETS TO CREATE A HOLISTIC, VIBRANT, AND SUSTAINABLE DEVELOPMENT.
146m 56m 2m 43m 2m
MANILA MAKATI9m
BGC PATEROSClark Green City Metro Manila
20
Clark Green City Geohazard: Flooding (Clark Green City and Metro Manila)
EAST VALLEY FAULT
Clark Green City Metro Manila
Clark Green City Active Fault Lines (Clark Green City and Metro Manila)
What Makes CGC Green & Smart?
Key Performance Indicators
RESOURCE MANAGEMENT ACCESSIBILITY IDENTITIY LEADERSHIP & GOVERNANCE DIVERSITY & DENSITY ECONOMIC VIBRANCY RESILIENCE Air Quality Reduced Automobile Dependence Good Public Spaces Collaboration Compact Development Stimulate Sustainable Growth Assess Climate Threat Biodiversity Alternative Modes of Transportation Heritage & Culture Management Mixed-Use Neighborhood Centers Improve Quality of Life Avoid Traps & Vulnerabilities Water Conservation Universal Design Public Health & Service Planning Mixed-Income Communities Develop Local Skills Prepare for Long-Term Adaptability & Short-Term Hazards Energy Efficiency Neighborhood Schools Local Food Production Materials
34,850 106,750 200,300 322,100 139,400 427,000 801,200 1,288,400 2020 2030 2040 2050
Employment Projection, Clark Green City, Based on Different Capture Rate, 2020F to 2050F
5% 10% 15% 20% Capture Rate Scenarios
# Workers
Recommended @1 mil
72,100 232,400 319,250 419,950 288,400 929,600 1,277,000 1,679,800 2020 2030 2040 2050
Population Projection, Clark Green City, Based on Different Capture Rate, 2020F to 2050F
5% 10% 15% 20% Capture Rate Scenarios Recommended @1.1 mil new + 233K existing/resettled
Clark Green City Residential & Employment Projections
more than 1.2 M population more than 800,000 jobs
Clark Green City Conceptual Master Plan
Land Use Distribution*
Clark Green City Conceptual Master Plan
314 318 501 315 91 266 403 54 100 553 233 106 Landfill Water Feature Road ROW Transport Hub Sports & Recreation Open Space Industrial Light Industrial Institutional Residential *excludes 5,567-ha. Timber Area
CALRK-BAMBAN-CAPAS RD FUTURE CONNECTION TO SCTEX Kalangitan Road San Nicolas Road Clark Green City Conceptual Master Plan
CALRK-BAMBAN-CAPAS RD FUTURE CONNECTION TO SCTEX Kalangitan Road San Nicolas RoadFood Terminal Industrial Park Farm
Clark International Airport, Subic Freeport, and to the region
diversification, trade relations and technological innovations.
Manufacturing Sector Agricultural Sector MANUFACTURING ZONE AGRI-INNOVATION HUB
CALRK-BAMBAN-CAPAS RD Clark Green City Conceptual Master Plan
CALRK-BAMBAN-CAPAS RD FUTURE CONNECTION TO SCTEX Kalangitan Road San Nicolas RoadCommercial Areas
CGC
Mixed Use Zone Commercial Core Expo
FINANCIAL DISTRICT COMMERCIAL CENTER
CALRK-BAMBAN-CAPAS RD Clark Green City Conceptual Master Plan
CALRK-BAMBAN-CAPAS RD FUTURE CONNECTION TO SCTEX Kalangitan Road San Nicolas RoadResidential Areas
varied community
groups
environment
Affordable Housing
MIXED-INCOME HOUSING LUXURY VILLAS CONDOMINIUMS
CALRK-BAMBAN-CAPAS RD Clark Green City Conceptual Master Plan
CALRK-BAMBAN-CAPAS RD FUTURE CONNECTION TO SCTEX Kalangitan Road San Nicolas RoadInstitutional Areas
with open space connectors
and medical facilities as well as government offices
Campus focused on research and internationalization
University Campus Government Center Civic Plaza Stadium
MIT RESEARCH CENTER NEW UP CAMPUS HEALTHCARE CENTER SPORTS CENTER CIVIC CENTER
CALRK-BAMBAN-CAPAS RD CGC Infrastructure Projects: ACCESS ROADS
Primary Access Roads
Lanes: 2 (initial) Length: 9 km Budget: 50 M (2015) Status: Notice to Proceed issued to Contractor by DPWH (April 20, 2015 – Day 01)
Lanes: 2 (initial) Length: 15 km Budget: 150 M (2015) Status: Topographic Survey for approval by DPWH & BCDA
2 1
CALRK-BAMBAN-CAPAS RDCLARK GREEN CITY
CLARK FREEPORT ZONE
CLARK INT’L AIRPORT
FUTURE CONNECTION TO SCTEX CGC Infrastructure Projects: ACCESS ROADS
PROPOSED ALIGNMENT
South Commuter Railway to CFZ Main Zone and CGC
Rail Operator
Partner to commence within 2Q 2015
CLARK RAIL TRANSIT SYSTEM (CRTS) NORTH-SOUTH COMMUTER RAIL (NSCR) PHASE 1
CGC
METRO MANILA
MALOLOS
CGC Infrastructure Projects: TRANSPORTATION
Clark Rail Transit System
37.9 kms 125.9 kms
CGC Infrastructure Projects: TRANSPORTATION Clark Rail Transit System GREENFIELD ALIGNMENT
TRANSIT-ORIENTED DEVELOPMENT (TOD) AT STATIONS
SAFE, EFFICIENT, COMFORTABLE, MODERN
CGC Infrastructure Projects: TRANSPORTATION
Clark Transit Bus System
proposed Bus Rapid Transit (BRT) System connecting Metro Manila to Clark Freeport Zone and CGC
UP NCTS
systems for Clark
START END
METRO MANILA Proposed Alignment
UTILITY TUNNEL
CGC Infrastructure Projects: UTILITIES
POWER TELECOM WATER GAS
construction to house all major utility lines
unobstructed views of the city
costs and disruptions due to recurrent excavation works
lines for maintenance works/repair
protection to utility lines
Integrated Utility Tunnel
Integrated Operation Center Crime Prevention Service Transportation Service Energy Mgmt Service Facility Mgmt Service Environment Service
Underground Facility Identification Water-pipe Monitoring Streetlight Monitoring Smart Signal Control Traffic Information Parking Information Illegal Parking Detection RFID Ticketing Environment Info Weather Info Intelligent Building System In-Building Communication Network Smart Office and Business Solutions CCTV Camera control Real-time video Analysis Monitoring & Decision Making
Operation Service for public benefit Operation Service for business
in Transportation, Safe & Security, Environment
for public
and business : Facility mgmt, Smart Card etc..
model
City-wide public services operated by Integrated Operation Center (IOC) make new city to be more convenient with not only efficiency but also financial benefit.
CGC Infrastructure Projects: UTILITIES
Integrated Operations Center
Opportunities with BCDA Land Development
BCDA is looking for Joint Venture Partners for:
Mixed-Use Development Industrial Estates Innovation District
LEASE
BUSINESS MODEL
TERMS LEASE PERIOD
FIXED LEASE 5% of the Fair Market Value of the Property VARIABLE LEASE Percentage of Gross Revenues from operations (e.g., commercial, rental) OTHER TERMS
BCDA (minority share)
PRIVATE SECTOR PARTNER (majority share)
property
EQUITY JOINT VENTURE FRAMEWORK
BUSINESS MODEL
Undertake the legal, financial, administrative, technical and other processes for the incorporation of the JVC Develops, Manages, and Leases the JV area to the locators 50 + 50 years Corporate Life
Long-term partnership with BCDA to build and operate utilities.
Opportunities with BCDA Development of Utilities
Technology/Business Process Outsourcing (ICT/BPO)
Opportunities with BCDA Target Locators
Clark Green City Tax and Fiscal Incentives
Earned
National Taxes
Importation of Equipment and Raw Materials
Property Tax
Goods within the Freeport
Clark Green City Committed Projects
CGC Access Roads Innovation Center Food Terminal TO SUBIC VIA FUTURE SCTEX CONNECTION DIRECT LINK TO CLARK INTERNATIONAL AIRPORT Affordable Housing GK Farm University Botanical Garden
ACTIVITIES 2014 2015 2016
1Q 2Q 3Q 4Q 1Q 2Q 3Q 4Q 1Q 2Q 3Q 4Q
CONSTRUCTION OF PRIMARY ACCESS ROADS REAL ESTATE DISPOSITION (PHASE 1) MASTERPLANNING OF THE NEW UP CAMPUS AT CGC CONDUCT OF FEASIBILITY STUDY FOR FOOD PROCESSING TERMINAL CONDUCT OF FEASIBILITY STUDIES FOR UTILITIES PROCUREMENT OF UTILITY PARTNERS DETAILED MASTER PLANNING BY REAL ESTATE PARTNER SITE DEVELOPMENT
Up to 2019 (Phase 1)
PRIORITY DEVELOPMENT PLAN
2014-2016
45
The BCDA Group @TheBCDAGroup bcda.gov.ph