
SLIDE 1
- R. Prutkin: Browsing large graphs as interactive maps
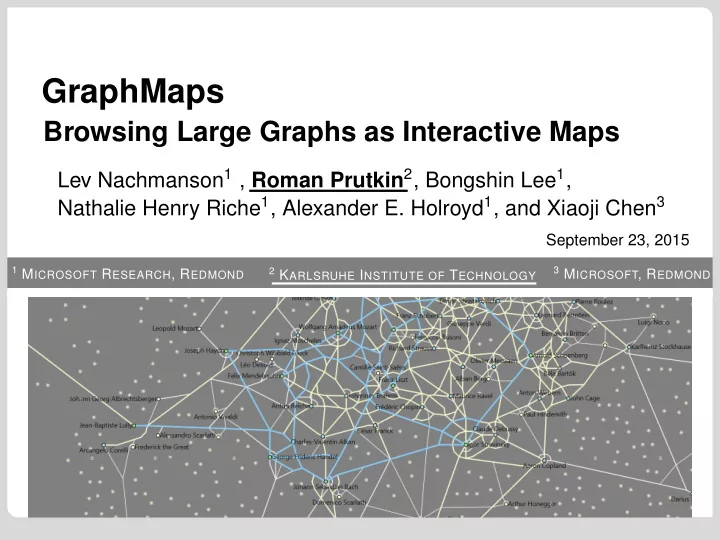
Browsing Large Graphs as Interactive Maps
Lev Nachmanson1 , Roman Prutkin2, Bongshin Lee1, Nathalie Henry Riche1, Alexander E. Holroyd1, and Xiaoji Chen3
September 23, 2015
1 MICROSOFT RESEARCH, REDMOND
GraphMaps
2 KARLSRUHE INSTITUTE OF TECHNOLOGY 3 MICROSOFT, REDMOND