
SLIDE 1
Graphs
Aaron Rendahl slides by Sanford Weisberg & G. Oehlert
School of Statistics University of Minnesota
February 9, 2009
STAT8801 (Univ. of Minnesota) Graphs February 9, 2009 1 / 45
Good Graphics
Fundamental Principal of Statistical Graphics
Above all else show the data. Ed Tufte Graphics can be . . . all that is read in an article . . . efficiently summarize a problem . . . very aesthetic . . . misleading or otherwise awful We must use them well, or else who will?
STAT8801 (Univ. of Minnesota) Graphs February 9, 2009 2 / 45
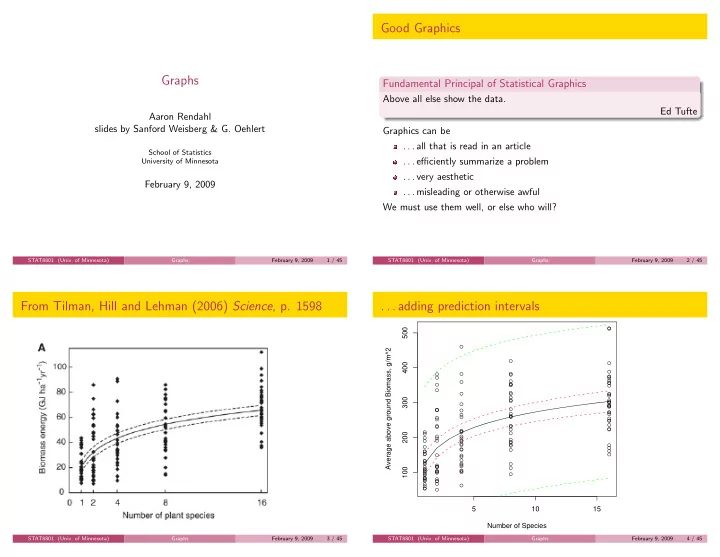
From Tilman, Hill and Lehman (2006) Science, p. 1598
STAT8801 (Univ. of Minnesota) Graphs February 9, 2009 3 / 45
. . . adding prediction intervals
- 5
10 15 100 200 300 400 500 Number of Species Average above ground Biomass, g/m^2
STAT8801 (Univ. of Minnesota) Graphs February 9, 2009 4 / 45