SLIDE 37 37
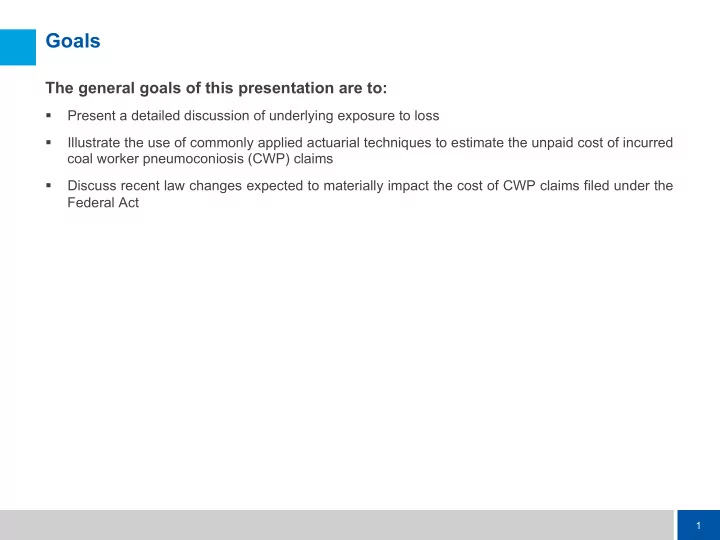
United States Department of Labor Data
CME Year 12 24 36 48 60 72 84 96 108 120 132 144 156 168 180 192 204 216 228 240 252 264 276 288 300 312 324 336 1983 939 ¡ ¡ ¡ ¡ ¡ 1,291 ¡ 1,466 ¡ 1,655 ¡ 1,825 ¡ 1,923 ¡ 2,013 ¡ 2,099 ¡ 2,163 ¡ 2,233 ¡ 2,282 ¡ 2,393 ¡ 2,442 ¡ 2,495 ¡ 2,546 ¡ 2,580 ¡ 2,607 ¡ 2,650 ¡ 2,707 ¡ 2,748 ¡ 2,779 ¡ 2,805 ¡ 2,830 ¡ 2,845 ¡ 2,869 ¡ 2,891 ¡ 2,910 ¡ 2,941 ¡ 1984 929 ¡ ¡ ¡ ¡ ¡ 1,346 ¡ 1,679 ¡ 1,915 ¡ 2,027 ¡ 2,140 ¡ 2,244 ¡ 2,336 ¡ 2,411 ¡ 2,500 ¡ 2,609 ¡ 2,669 ¡ 2,720 ¡ 2,760 ¡ 2,800 ¡ 2,824 ¡ 2,864 ¡ 2,921 ¡ 2,995 ¡ 3,046 ¡ 3,087 ¡ 3,112 ¡ 3,137 ¡ 3,164 ¡ 3,184 ¡ 3,209 ¡ 3,246 ¡ 1985 855 ¡ ¡ ¡ ¡ ¡ 1,541 ¡ 1,872 ¡ 2,065 ¡ 2,197 ¡ 2,327 ¡ 2,434 ¡ 2,519 ¡ 2,603 ¡ 2,714 ¡ 2,789 ¡ 2,849 ¡ 2,911 ¡ 2,951 ¡ 2,987 ¡ 3,038 ¡ 3,119 ¡ 3,178 ¡ 3,231 ¡ 3,263 ¡ 3,308 ¡ 3,349 ¡ 3,375 ¡ 3,394 ¡ 3,420 ¡ 3,468 ¡ 1986 1,043 ¡ 1,730 ¡ 2,071 ¡ 2,277 ¡ 2,413 ¡ 2,563 ¡ 2,668 ¡ 2,777 ¡ 2,905 ¡ 2,985 ¡ 3,049 ¡ 3,125 ¡ 3,178 ¡ 3,216 ¡ 3,266 ¡ 3,369 ¡ 3,435 ¡ 3,485 ¡ 3,529 ¡ 3,580 ¡ 3,620 ¡ 3,653 ¡ 3,692 ¡ 3,729 ¡ 3,782 ¡ 1987 943 ¡ ¡ ¡ ¡ ¡ 1,500 ¡ 1,773 ¡ 1,962 ¡ 2,102 ¡ 2,220 ¡ 2,316 ¡ 2,435 ¡ 2,527 ¡ 2,579 ¡ 2,650 ¡ 2,701 ¡ 2,735 ¡ 2,784 ¡ 2,864 ¡ 2,925 ¡ 2,963 ¡ 2,998 ¡ 3,031 ¡ 3,075 ¡ 3,109 ¡ 3,140 ¡ 3,172 ¡ 3,223 ¡ 1988 647 ¡ ¡ ¡ ¡ ¡ 1,115 ¡ 1,367 ¡ 1,549 ¡ 1,679 ¡ 1,785 ¡ 1,909 ¡ 1,979 ¡ 2,037 ¡ 2,090 ¡ 2,132 ¡ 2,158 ¡ 2,204 ¡ 2,283 ¡ 2,375 ¡ 2,422 ¡ 2,457 ¡ 2,498 ¡ 2,526 ¡ 2,550 ¡ 2,572 ¡ 2,600 ¡ 2,645 ¡ 1989 581 ¡ ¡ ¡ ¡ ¡ 1,020 ¡ 1,283 ¡ 1,453 ¡ 1,586 ¡ 1,754 ¡ 1,830 ¡ 1,889 ¡ 1,961 ¡ 2,013 ¡ 2,047 ¡ 2,091 ¡ 2,154 ¡ 2,225 ¡ 2,268 ¡ 2,305 ¡ 2,345 ¡ 2,382 ¡ 2,408 ¡ 2,433 ¡ 2,476 ¡ 2,530 ¡ 1990 521 ¡ ¡ ¡ ¡ ¡ 1,003 ¡ 1,256 ¡ 1,445 ¡ 1,629 ¡ 1,748 ¡ 1,816 ¡ 1,897 ¡ 1,948 ¡ 1,997 ¡ 2,061 ¡ 2,171 ¡ 2,267 ¡ 2,321 ¡ 2,369 ¡ 2,425 ¡ 2,471 ¡ 2,509 ¡ 2,543 ¡ 2,585 ¡ 2,671 ¡ 1991 590 ¡ ¡ ¡ ¡ ¡ 1,081 ¡ 1,397 ¡ 1,673 ¡ 1,804 ¡ 1,914 ¡ 2,000 ¡ 2,070 ¡ 2,120 ¡ 2,192 ¡ 2,334 ¡ 2,443 ¡ 2,510 ¡ 2,567 ¡ 2,617 ¡ 2,671 ¡ 2,715 ¡ 2,768 ¡ 2,810 ¡ 2,879 ¡ 1992 477 ¡ ¡ ¡ ¡ ¡ 953 ¡ ¡ ¡ ¡ ¡ 1,333 ¡ 1,524 ¡ 1,649 ¡ 1,779 ¡ 1,866 ¡ 1,943 ¡ 2,039 ¡ 2,171 ¡ 2,288 ¡ 2,333 ¡ 2,381 ¡ 2,442 ¡ 2,491 ¡ 2,543 ¡ 2,581 ¡ 2,628 ¡ 2,716 ¡ 1993 455 ¡ ¡ ¡ ¡ ¡ 965 ¡ ¡ ¡ ¡ ¡ 1,139 ¡ 1,268 ¡ 1,405 ¡ 1,513 ¡ 1,573 ¡ 1,653 ¡ 1,808 ¡ 1,942 ¡ 2,012 ¡ 2,056 ¡ 2,112 ¡ 2,167 ¡ 2,203 ¡ 2,242 ¡ 2,277 ¡ 2,356 ¡ 1994 626 ¡ ¡ ¡ ¡ ¡ 981 ¡ ¡ ¡ ¡ ¡ 1,174 ¡ 1,342 ¡ 1,450 ¡ 1,529 ¡ 1,640 ¡ 1,798 ¡ 1,952 ¡ 2,033 ¡ 2,096 ¡ 2,171 ¡ 2,223 ¡ 2,281 ¡ 2,324 ¡ 2,379 ¡ 2,471 ¡ 1995 308 ¡ ¡ ¡ ¡ ¡ 551 ¡ ¡ ¡ ¡ ¡ 745 ¡ ¡ ¡ ¡ ¡ 854 ¡ ¡ ¡ ¡ ¡ 948 ¡ ¡ ¡ ¡ ¡ 1,074 ¡ 1,255 ¡ 1,405 ¡ 1,466 ¡ 1,520 ¡ 1,568 ¡ 1,621 ¡ 1,666 ¡ 1,713 ¡ 1,765 ¡ 1,858 ¡ 1996 240 ¡ ¡ ¡ ¡ ¡ 480 ¡ ¡ ¡ ¡ ¡ 602 ¡ ¡ ¡ ¡ ¡ 705 ¡ ¡ ¡ ¡ ¡ 811 ¡ ¡ ¡ ¡ ¡ 973 ¡ ¡ ¡ ¡ ¡ 1,118 ¡ 1,180 ¡ 1,229 ¡ 1,307 ¡ 1,349 ¡ 1,395 ¡ 1,433 ¡ 1,470 ¡ 1,550 ¡ 1997 236 ¡ ¡ ¡ ¡ ¡ 457 ¡ ¡ ¡ ¡ ¡ 613 ¡ ¡ ¡ ¡ ¡ 749 ¡ ¡ ¡ ¡ ¡ 933 ¡ ¡ ¡ ¡ ¡ 1,086 ¡ 1,159 ¡ 1,219 ¡ 1,271 ¡ 1,320 ¡ 1,372 ¡ 1,409 ¡ 1,450 ¡ 1,520 ¡ 1998 273 ¡ ¡ ¡ ¡ ¡ 521 ¡ ¡ ¡ ¡ ¡ 715 ¡ ¡ ¡ ¡ ¡ 968 ¡ ¡ ¡ ¡ ¡ 1,130 ¡ 1,223 ¡ 1,312 ¡ 1,376 ¡ 1,420 ¡ 1,485 ¡ 1,537 ¡ 1,587 ¡ 1,703 ¡ 1999 289 ¡ ¡ ¡ ¡ ¡ 544 ¡ ¡ ¡ ¡ ¡ 863 ¡ ¡ ¡ ¡ ¡ 1,050 ¡ 1,145 ¡ 1,242 ¡ 1,323 ¡ 1,372 ¡ 1,423 ¡ 1,463 ¡ 1,511 ¡ 1,636 ¡ 2000 240 ¡ ¡ ¡ ¡ ¡ 487 ¡ ¡ ¡ ¡ ¡ 654 ¡ ¡ ¡ ¡ ¡ 764 ¡ ¡ ¡ ¡ ¡ 829 ¡ ¡ ¡ ¡ ¡ 893 ¡ ¡ ¡ ¡ ¡ 940 ¡ ¡ ¡ ¡ ¡ 979 ¡ ¡ ¡ ¡ ¡ 1,017 ¡ 1,052 ¡ 1,124 ¡ 2001 230 ¡ ¡ ¡ ¡ ¡ 442 ¡ ¡ ¡ ¡ ¡ 561 ¡ ¡ ¡ ¡ ¡ 629 ¡ ¡ ¡ ¡ ¡ 685 ¡ ¡ ¡ ¡ ¡ 723 ¡ ¡ ¡ ¡ ¡ 768 ¡ ¡ ¡ ¡ ¡ 809 ¡ ¡ ¡ ¡ ¡ 838 ¡ ¡ ¡ ¡ ¡ 904 ¡ ¡ ¡ ¡ ¡ 2002 314 ¡ ¡ ¡ ¡ ¡ 600 ¡ ¡ ¡ ¡ ¡ 735 ¡ ¡ ¡ ¡ ¡ 834 ¡ ¡ ¡ ¡ ¡ 912 ¡ ¡ ¡ ¡ ¡ 1,003 ¡ 1,063 ¡ 1,125 ¡ 1,221 ¡ 2003 268 ¡ ¡ ¡ ¡ ¡ 460 ¡ ¡ ¡ ¡ ¡ 572 ¡ ¡ ¡ ¡ ¡ 667 ¡ ¡ ¡ ¡ ¡ 732 ¡ ¡ ¡ ¡ ¡ 784 ¡ ¡ ¡ ¡ ¡ 837 ¡ ¡ ¡ ¡ ¡ 941 ¡ ¡ ¡ ¡ ¡ 2004 177 ¡ ¡ ¡ ¡ ¡ 395 ¡ ¡ ¡ ¡ ¡ 472 ¡ ¡ ¡ ¡ ¡ 550 ¡ ¡ ¡ ¡ ¡ 597 ¡ ¡ ¡ ¡ ¡ 647 ¡ ¡ ¡ ¡ ¡ 747 ¡ ¡ ¡ ¡ ¡ 2005 137 ¡ ¡ ¡ ¡ ¡ 247 ¡ ¡ ¡ ¡ ¡ 324 ¡ ¡ ¡ ¡ ¡ 382 ¡ ¡ ¡ ¡ ¡ 419 ¡ ¡ ¡ ¡ ¡ 481 ¡ ¡ ¡ ¡ ¡ 2006 220 ¡ ¡ ¡ ¡ ¡ 409 ¡ ¡ ¡ ¡ ¡ 480 ¡ ¡ ¡ ¡ ¡ 544 ¡ ¡ ¡ ¡ ¡ 633 ¡ ¡ ¡ ¡ ¡ 2007 232 ¡ ¡ ¡ ¡ ¡ 388 ¡ ¡ ¡ ¡ ¡ 467 ¡ ¡ ¡ ¡ ¡ 574 ¡ ¡ ¡ ¡ ¡ 2008 127 ¡ ¡ ¡ ¡ ¡ 229 ¡ ¡ ¡ ¡ ¡ 335 ¡ ¡ ¡ ¡ ¡ 2009 205 ¡ ¡ ¡ ¡ ¡ 474 ¡ ¡ ¡ ¡ ¡ 2010 177 ¡ ¡ ¡ ¡ ¡
Countrywide
Living ¡Miner ¡Filings