
SLIDE 1
12 November 2014
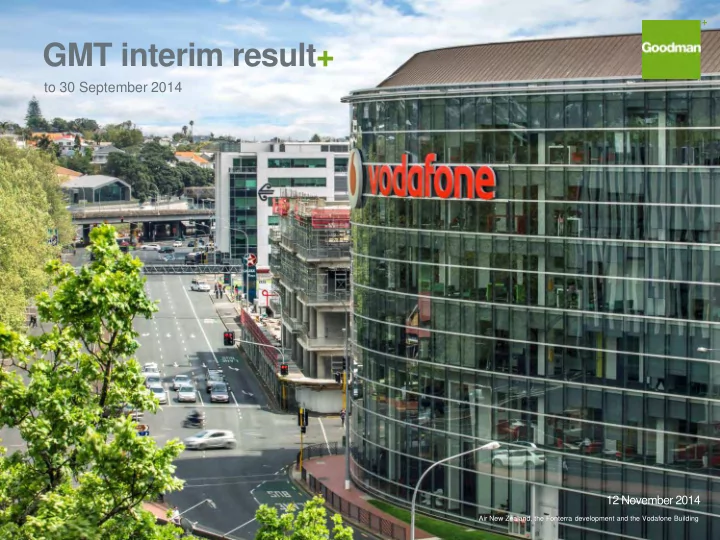
GMT interim result+
to 30 September 2014
Air New Zealand, the Fonterra development and the Vodafone Building
GMT interim result+ to 30 September 2014 12 November 2014 Air New - - PowerPoint PPT Presentation
GMT interim result+ to 30 September 2014 12 November 2014 Air New Zealand, the Fonterra development and the Vodafone Building contents+ 01 delivering on strategy+ 02 Viaduct Quarter+ 03 financial result+ 04 investment portfolio+ 05 development
12 November 2014
to 30 September 2014
Air New Zealand, the Fonterra development and the Vodafone Building
Murray Barclay, General Manager Property Services , Goodman, with David Gell, Property Asset Manager, Bridgestone New Zealand Ltd
Michael Gimblett, Goodman Development Manager and Andrew Rolf, Fletcher Construction Project Manager on the Fonterra construction site.
4
A growing economy is continuing to generate strong customer demand for high quality, well located business space. The strategy of the Trust has been refined to take advantage of these conditions with a range of new initiatives being implemented, they include
Accelerated development programme - $77.9 million of new projects yielding 8.0%
Asset recycling to fund development activity - $64.2 million of sales1
Distribution Reinvestment Plan suspended - Improving investment performance
Corporate governance refinements - Closer alignment with company structure
Revised management fee - Refining an already competitive fee structure
New co-investment partner - An expanded JV to fund Viaduct investments A focus on sustainable growth, with asset sales financing an accelerated development programme, is converting the Trust’s strategic land holdings into high quality, income producing assets. New corporate initiatives, backed by a 99.8% Unitholder approval and strategic partnerships are also refining the business.
Fonterra under construction and the Vodafone building
6
+ Viaduct Quarter identified as key area of commercial growth in Auckland's unitary plan + Location and asset class is consistent with GMT’s investment strategy, $235 million already committed + Some of the Trust’s strongest performing office assets over the last 10 years + The introduction of new co-investor facilitates the growth of this investment, enhancing GMT’s portfolio, without the requirement for any significant new funding + Other benefits to GMT include:
portfolio
7
Auckland’s Viaduct
+ The existing joint venture partner disposed of its interests in the Vodafone, KPMG, Microsoft and HP buildings at March 2014 valuations + The Air New Zealand building, which was
million, is being sold into the joint venture at its March 2014 valuation of $64.0 million + The Fonterra building, which was acquired ahead
being sold into the joint venture for $93.2 million
8
Fonterra and Vodafone buildings Microsoft and HP Air New Zealand
+ Mandate to grow to around $500 million over time + New opportunities will require GNZ Board approval + Investing in high quality, campus style office properties, occupied by major customers on long term leases + Investment hurdles of the joint venture are aligned with the Trust + Board of the joint venture to contain equal membership from GMT and GIC
9
KPMG and Vodafone
Bridgestone New Zealand Ltd at Glassworks Industry Park, Christchurch
11
how this measure is calculated.
Earnings and Profit
+ Net rental income increased 4.9% to $66.2 million + Distributable earnings before tax1 of $55.5 million or 4.53 cpu (4.18 cpu in pcp) + Distributable earnings after tax1 of $52.4 million or 4.28 cpu (3.78 cpu in pcp) + $65.3 million before tax profit compared to $70.1 million in pcp + $60.2 million after tax profit compared to $65.4 million in pcp + Valuation gains on completed and partially complete developments of $14.5 million
Capital Management
+ Suspension of Distribution Reinvestment Plan + Disposals totalling $64.2 million2 to fund new development + New capital partner in Viaduct joint venture + Loan to value ratio of 36.5%3 + Interest cover of 2.7 times on GMT facility + $600 million refinancing of GMT’s main facility in October 2014 + Weighted remaining term of GMT main facility now 3.5 years
12
presentation for details on how this measure is calculated.
6 months ended 30 Sep 2014 $m 30 Sep 2013 $m Change % Net rental and related income 66.2 63.1 4.9 Gain on disposal of property investments 4.3
13.7 6.1 124.4 Movement in fair value of derivative financial instruments (4.2) 14.1 (130.1) Share of profit arising from joint ventures, net of tax 1.4 2.9 (52.6) Other administrative expenses (4.6) (4.9) 6.5 Net finance costs (11.5) (11.2) (2.9) Profit before income tax 65.3 70.1 (6.9) Taxation (5.1) (4.7) (8.1) Profit after income tax 60.2 65.4 (8.0) Distributable earnings before tax1 55.5 50.3 10.4 Tax on distributable earnings (3.1) (4.7) 34.0 Distributable earnings after tax 52.4 45.6 15.0
Note: Values in table above may not appear to sum accurately due to rounding
13
1. Net of cash and unamortised bond issue costs 2. Net of cash, unamortised bond issue costs and after adjusting for unconditional disposals. Includes GMT’s equity accounted share of joint venture debt facility 3. As a result of the recognition of the value of equity relating to the deferred consideration component of the Highbrook Acquisitions, GMT’s net tangible assets per unit is calculated as if those deferred issue units had already been issued.
as at 30 Sep 2014 $m 31 Mar 2014 $m Change %
Total assets 2,196.8 2,118.3 3.7 Property assets 2,120.1 2,039.8 3.9 Net borrowings1 787.9 734.2 (7.3) Total liabilities 908.3 852.7 (6.5) Equity 1,288.5 1,265.6 1.8 Loan to Value (%)2 36.5 36.0 NTA per unit (cpu) 3 102.1 100.4 1.7
Note: Values in table above may not appear to sum accurately due to rounding
+ Active capital management programme: – Disposal of $64.21 million of assets to fund development – Suspension of the Distribution Reinvestment Plan – Seek to maintain funding diversity + Strong balance sheet position: – 36.5%2 loan to value ratio at the bottom of the Board’s targeted range of 35% to 40% + An interest cover ratio of 2.7 times at 30 September 2014
14 1. Includes sales unconditionally contracted up to 11 November 2014 2. Net of cash, unamortised bond issue costs and after adjusting for unconditional disposals and including GMT’s equity accounted share of joint venture debt facility
2.7 2.0 Sept 14 actual Covenant
Interest cover position
+ Currently 70.5%1 hedged with an average remaining term of 3.4 years across its swap book + $600 million refinancing of the Trust’s main facility in October 2014 with syndicate extended to include HSBC + Weighted remaining term of GMT bank facility now 3.5 years
15 1. Includes GMT’s share of joint venture hedging 2. Debt facilites at 16 October 2014
Debt facilities maturity profile - $ millions2
150 150 150 150 150 45 100 26
25 50 75 100 125 150 175 FY15 H2 FY16 H1 FY16 H2 FY17 H1 FY17 H2 FY18 H1 FY18 H2 FY19 H1 FY19 H2 FY20 H1 FY20 H2 FY21 H1 FY21 H2
GMT bank facility Bonds GMT share of JV facility
Panasonic, Highbrook Business Park
DHL Warehouse, Glassworks Industry Park, Christchurch
+ Over 71,000 sqm of space secured on new or revised terms + WALT of 5.5 years + Average occupancy of around 97% + Occupancy 97% at 30 September 2014
17
63.0 66.2 3.3 1.2 (1.3) 3.0 3.0 66.0 69.2 50.0 55.0 60.0 65.0 70.0 75.0
FY14 Disposals New developments Underlying portfolio FY15
Look through net property income bridge1 H1 FY14 to H1 FY15
GMT GMT share of JV
+ Over 35,000 sqm of vacant space leased as part of Project Big Footprint
18
Customer Estate NLA
Turners Penrose Industrial Estate 15,200 sqm DSL Logistics Westney Industry Park 7,700 sqm Mainfreight Highbrook Business Park 6,700 sqm Kmart M20 Business Park 5,400 sqm YOUI Central Park Corporate Centre 4,600 sqm Owens Transport Southpark Industrial Estate 4,500 sqm
+ Disposal of six assets for $64.2 million1 at an average exit yield of 7.25% + $136 million of sales in the last 2.5 years + Sales to continue to fund new development activity
19
SMEC NZ House Placemakers Big Chill Carter Holt Harvey
Genesis Building, Central Park
+ $77.9 million of new development commitments yielding 8.0% + Three new warehouse developments at Highbrook including facilities for Ford and Steel & Tube + New 10,503 sqm facility for Steel & Tube at Savill Link + New car park building at Central Park to meet customer demand and facilitate further development + Extension of existing warehouse facility for DSL at Westney
21
Steel & Tube, Savill Link Central Park car park Ford, Highbrook
Indicative illustration of development activity under way at Savill Link, Highbrook and Central Park
22
Indicative illustration of development activity under way at Highbrook Business Park, Auckland
23
Indicative illustration of development activity under way at Central Park Corporate Centre Auckland
+ New Developments – Commencement of over 36,836 sqm1 of new development projects
+ Land weighting of 10.5%2 at 30 September 2014
24
Artists impression
GMT development activity
75,164 104,480 83,139 106,608 35,318 29,008 9,336 49,615 48,218 59,738 36,836
FY5 FY6 FY7 FY8 FY9 FY10 FY11 FY12 FY13 FY14 FY15
NLA sqm YTD NLA sqm
25
Highbrook Business Park
Customer Pelikan Artline NLA1 2,805 sqm WALT 9 years Valuation $4.1m Market Cap Rate 6.75%
Highbrook Business Park
Customer Mainfreight NLA1 6,676 sqm WALT 6 years Valuation $11.4m Market Cap Rate 6.75%
26
Glassworks Industry Park Glassworks Industry Park
Customer MOVE Logistics NLA1 5,817 sqm WALT 8 years Valuation $11.1m Market Cap Rate 7.00% Customer DHL NLA1 6,708 sqm WALT 5 years Valuation $13.0m Market Cap Rate 7.13%
Pelikan Artline, Highbrook Business Park
28
Strategy
+ Active strategy + Continuation of the Trust’s accelerated development programme + Asset disposals will fund new development activity + Focus on maximising portfolio rental streams
New Joint Venture
+ Strongly aligned capital partner + Focus on high quality, campus style office properties + Increase in range of capital options for future opportunities
Outlook
+ Growing economy and strong property market fundamentals + Demand for high quality, well located business space + Focus on delivering strong profits and sustainable long term earnings growth
Summary
+ New corporate initiatives ensure the Trust remains a leading investment entity + Pre-tax distributable earnings guidance of around 9.1 cpu reaffirmed + Cash distributions expected to be around 6.45 cpu + Active strategy will continue to improve cash earnings
Show Place Office Park, Addington, Christchurch
30
For the six months ended 30 Sep 2014 $m 30 Sep 2013 $m
Profit after tax 60.2 65.4 Gain on disposal of property investments (4.3)
(13.7) (6.1) Movement in fair value of derivative financial instruments 4.2 (14.1) Fund management fee to be settled in units 3.1
Interest on deferred vendor settlements 0.1 0.3 Non-distributable items included in share of profit arising from joint ventures 0.3 (1.2) Income tax expense included in share of profit arising from joint ventures 0.5 0.2 Income tax expense 5.1 4.7 Distributable earnings before tax 55.5 50.3 Taxation on distributable earnings (3.1) (4.7) Distributable earnings after tax 52.4 45.6
Note: Values in table above may not appear to sum accurately due to rounding
Distributable earnings is an alternative performance measure used to assist investors in assessing the Trust’s underlying operating performance.