Global Projections for the Diabetes Global Projections for the - - PDF document

global projections for the diabetes global projections
SMART_READER_LITE
LIVE PREVIEW

Global Projections for the Diabetes Global Projections for the - - PDF document

WHY ARE WE CONCERNED ABOUT WHY ARE WE CONCERNED ABOUT DIABETES AND ITS LONG TERM DIABETES AND ITS LONG TERM COMPLICATIONS? COMPLICATIONS? BAD NEWS! BAD NEWS! Global Projections for the Diabetes Global Projections for the Diabetes Epidemic:


slide-1
SLIDE 1

1

WHY ARE WE CONCERNED ABOUT WHY ARE WE CONCERNED ABOUT DIABETES AND ITS LONG TERM DIABETES AND ITS LONG TERM COMPLICATIONS? COMPLICATIONS? BAD NEWS! BAD NEWS!

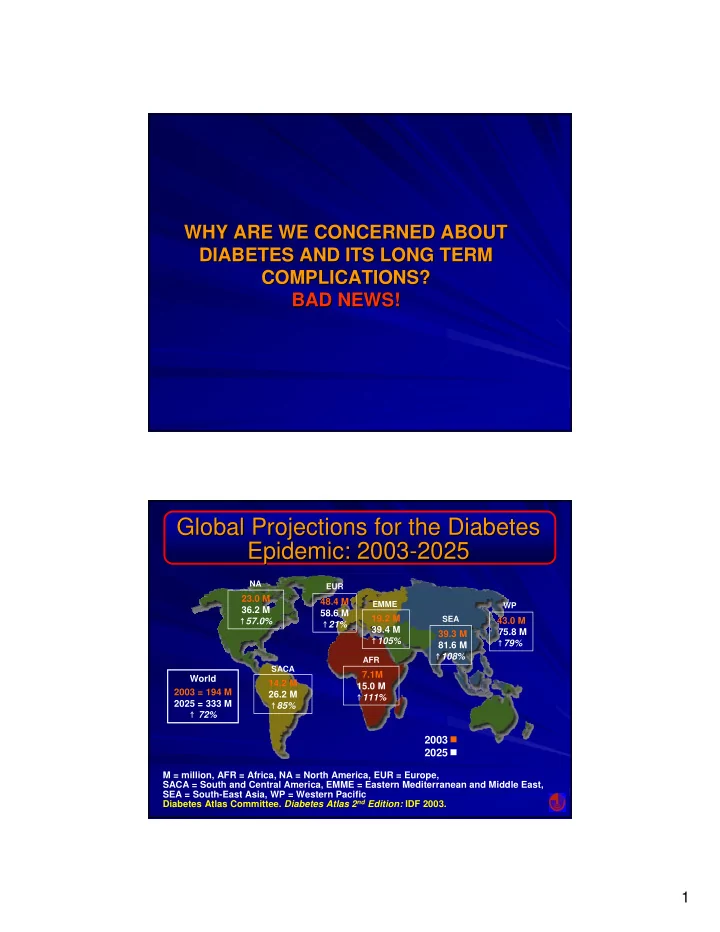
23.0 M 36.2 M ↑57.0% 14.2 M 26.2 M ↑85% 48.4 M 58.6 M ↑21% 43.0 M 75.8 M ↑79% 7.1M 15.0 M ↑111% 39.3 M 81.6 M ↑108% M = million, AFR = Africa, NA = North America, EUR = Europe, SACA = South and Central America, EMME = Eastern Mediterranean and Middle East, SEA = South-East Asia, WP = Western Pacific Diabetes Atlas Committee. Diabetes Atlas 2nd Edition: IDF 2003. World 2003 = 194 M 2025 = 333 M ↑ 72%

AFR NA SACA EUR SEA WP

19.2 M 39.4 M ↑105%

EMME

2003 2025

Global Projections for the Diabetes Global Projections for the Diabetes Epidemic: 2003 Epidemic: 2003-

  • 2025

2025

slide-2
SLIDE 2

2

Diabetes Diabetes in the World in the World

( (20

20-

  • 79

79 age age group ) group ) 2007:246.000.000 2007:246.000.000

2025 :380.000.000* 2025 :380.000.000*

*7.1% of the *7.1% of the Adult Adult Population Population 80% In 80% In Developing Developing Countries Countries

Impaired Impaired Glucose Glucose Tolerance Tolerance in the World in the World

2007 :308.000.000 2007 :308.000.000

2025: 418.000.000* 2025: 418.000.000* *8.1% of the World *8.1% of the World Population Population 80% in 80% in Developing Developing Countries Countries

slide-3
SLIDE 3

3

Diabetes Diabetes + IGT In the World in + IGT In the World in 2007 2007

~550.000.000 ~550.000.000 ~13% of the ~13% of the Adult Adult Population Population

Diabetes Diabetes + IGT in the World in + IGT in the World in 2025 2025

~800.000.000 ~800.000.000 >15% >15% Adult Adult Population Population

slide-4
SLIDE 4

4

90% to 95% of cases are type 2 diabetes

Diabetes Mellitus in the United States: Diabetes Mellitus in the United States: Overview Overview

Prevalence Prevalence 22 million Americans (5.9% of the population) 22 million Americans (5.9% of the population) – – 14.5 million diagnosed 14.5 million diagnosed – – 7.5 million not diagnosed 7.5 million not diagnosed Incidence Incidence 1000,000 new cases diagnosed yearly 1000,000 new cases diagnosed yearly Leading cause of Leading cause of – – blindness in adults blindness in adults – – end end-

  • stage renal disease

stage renal disease – – nontraumatic amputations nontraumatic amputations Healthcare costs: $174 billion 2001 Healthcare costs: $174 billion 2001

  • ADA. Diabetes Care. 1998;21:296-309.
  • NIDDK. Diabetes Statistics. NIH Publication No. 98-3926; November 1997 (updated February 1998).

Men and Women, Age 45-74 Years

Harris et al. Diabetes. 1987;36:523. Flegal et al. Diabetes Care. 1991;14(suppl 3):628. Knowler et al. Diabetes Care. 1993;16(suppl 1):216. Fujimoto et al. Diabetes Res Clin Pract. 1991;13:119. Fujimoto et al. Diabetes. 1987;36:721.

% with diabetes 10 20 30 40 50

Pima Puerto Rican Mexican American African American Japanese American Cuban American European

US Diabetes Prevalence US Diabetes Prevalence by Ethnic Group by Ethnic Group

slide-5
SLIDE 5

5

Obesity and Diabetes Trends in the US Obesity and Diabetes Trends in the US

Mokdad Mokdad et al. et al. JAMA.

  • JAMA. 2003;289:76

2003;289:76-

  • 79.

79. No Data < 10% 10% -14% 15% -19% 20% -24% ≥25%

Obesity Diabetes

1991 2001 1991 2001 No Data < 4% 4% -6% 7% -8% 9% -10% > 10%

Diabetes Trends Among Adults in the Diabetes Trends Among Adults in the U.S U.S

No Data Less than 4% 4% to 6% Above 6% Above 10%

Mokdad et al. Diabetes Care 2000;23:1278-83; J Am Med Assoc 2001;286(10). www.diabetes.org.

1990 1995 2000 2010

slide-6
SLIDE 6

6

Mokdad et al. J Am Med Assoc. 2000;284:13.

Obesity Trends Among US Adults* Obesity Trends Among US Adults* BRFSS, 2000 BRFSS, 2000

*BMI ≥30, or ~30 lb overweight for 5'4" woman. No Data <10% 10%-14% 15%-19% ≥20%

Obesity Trends* Among US Obesity Trends* Among US Adults, BRFSS 2001 Adults, BRFSS 2001

No Data <10% 10%-14% 15%-19% 20-24% ≥25% *BMI ≥30, or ~30 lbs overweight for 5’4” woman. Mokdad AH et al. J Am Med Assoc. 2003;289:76-79.

slide-7
SLIDE 7

7

Obesity Trends* Among U.S. Adults Obesity Trends* Among U.S. Adults BRFSS, 2005 BRFSS, 2005

(*BMI ≥30, or ~ 30 lbs. overweight for 5’ 4” person) No Data <10% 10%–14% 15%–19% 20%–24% 25%–29% ≥30%

Obesity Trends* Among U.S. Adults Obesity Trends* Among U.S. Adults BRFSS, 2006 BRFSS, 2006

(*BMI ≥30, or ~ 30 lbs. overweight for 5’ 4” person) No Data <10% 10%–14% 15%–19% 20%–24% 25%–29% ≥30%

slide-8
SLIDE 8

8

Obesity Trends* Among U.S. Adults Obesity Trends* Among U.S. Adults BRFSS, 2007 BRFSS, 2007

(*BMI ≥30, or ~ 30 lbs. overweight for 5’ 4” person) No Data <10% 10%–14% 15%–19% 20%–24% 25%–29% ≥30%

Obesity Trends* Among U.S. Adults Obesity Trends* Among U.S. Adults BRFSS, 2008 BRFSS, 2008

(*BMI ≥30, or ~ 30 lbs. overweight for 5’ 4” person) No Data <10% 10%–14% 15%–19% 20%–24% 25%–29% ≥30%

slide-9
SLIDE 9

9

BMI = body mass index. *Age-adjusted by the direct method to the year 2000 US Bureau of the Census estimates using the age groups 20-34, 35-44, 45-54, 55-64, and 65-74 years.

47

60 40 20 80

NHANES II 1976-80 (n=11,207) NHANES 1999 (n=1446)

Overweight or obese (BMI ≥25.0) Overweight (BMI 25.0-29.9) Obese (BMI ≥30.0)

56 61 32 33 34 15 23 27 NHANES III 1988-94 (n=14,468)

Percent

Prevalence of Overweight and Prevalence of Overweight and Obesity Among US Adults, Age 20 Obesity Among US Adults, Age 20-

  • 74 Years*

74 Years* Prevalence of Overweight Among Prevalence of Overweight Among US Children and Adolescents US Children and Adolescents

7.2 10.4 11.3 15.3 10.5 15.5 2 4 6 8 10 12 14 16 Age 2-5 Age 6-11 Age 12-19

NHANES III (1988-1994) NHANES (1999-2000) NHANES=National Health and Nutrition Examination Survey. Ogden CL et al. JAMA. 2002;288:1728-1732.

% %

slide-10
SLIDE 10

10

Ethnic Distribution of Diabetes in Ethnic Distribution of Diabetes in Children Children

Scott et al. Pediatrics. 1997;100:84.

10 20 30 40 50 60 70 80 90 100

White African-American Other

Type 2 diabetes Type 1 diabetes

74% 24% 2% 18% 82% 0% % of diabetes in children

The fear for our children is The fear for our children is the epidemic of the epidemic of longterm longterm diabetic complications in diabetic complications in the 3 the 3rd

rd decade of life in the

decade of life in the youths with diabetes youths with diabetes

slide-11
SLIDE 11

11

Estimated Prevalence of Diabetes by Age Group, Estimated Prevalence of Diabetes by Age Group, Race and Male Gender, Race and Male Gender, with Odds Ratios (OR), Ohio 2005 Ohio 20051

1.

.

1.2 6.8 6.2 3.4 11.3 36.0 16.4 27.4 5 10 15 20 25 30 35 40 Percent (%) 18-34 35-49 50-64 65+ Age Group (Years)

White Male Black Male

1Source: Behavioral Risk Factor Surveillance System; Chronic Disease and Behavioral

Epidemiology; Surveillance – Prevention; Ohio Department of Health, 2006.

O.R. = 0.5 O.R. = 5.7 O.R. = 3.2 O.R. = 1.7

Estimated Prevalence of Diabetes by Age Group, Estimated Prevalence of Diabetes by Age Group, Race and Female Gender, Race and Female Gender, with Odds Ratios (OR), Ohio 2005 Ohio 20051

1.

.

1Source: Behavioral Risk Factor Surveillance System; Chronic Disease and Behavioral

Epidemiology; Surveillance – Prevention; Ohio Department of Health, 2006.

0.6 1.0 3.5 12.2 10.3 24.3 16.1 23.2 5 10 15 20 25 30 Percent (%) 18-34 35-49 50-64 65+ Age Group (Years)

White Female Black Female

O.R. = 3.5 O.R. = 2.4 O.R. = 1.7 O.R. = 1.4

slide-12
SLIDE 12

12

Estimated Prevalence of Diabetes by Age Estimated Prevalence of Diabetes by Age Group, Group, with Odds Ratios (OR), Ohio 2005 Ohio 20051

1

1.1 5.3 12.2 16.6

2 4 6 8 10 12 14 16 18 Percent (% ) 18-34 35-49 50-64 65+ Age Group (Years)

1Source: Behavioral Risk Factor Surveillance System; Chronic Disease and Behavioral

Epidemiology; Surveillance – Prevention; Ohio Department of Health, 2006.

O.R. = 4.8 O.R. = 11.1 O.R. = 15.1

Estimated Prevalence of Diabetes by Age Group Estimated Prevalence of Diabetes by Age Group and Race, and Race, with Odds Ratios (OR), Ohio 2005 Ohio 20051

1.

.

0.9 3.1 4.9 8.3 10.8 28.4 16.2 24.7 5 10 15 20 25 30 Percent (%) 18-34 35-49 50-64 65+ Age Group (Years)

White Black 1Source: Behavioral Risk Factor Surveillance System; Chronic Disease and Behavioral

Epidemiology; Surveillance – Prevention; Ohio Department of Health, 2006.

O.R. = 1.7 O.R. = 3.4 O.R. = 2.6 O.R. = 1.5

slide-13
SLIDE 13

13

Estimated Prevalence of Diabetes by Estimated Prevalence of Diabetes by Race / Ethnicity, Ohio 2005 Race / Ethnicity, Ohio 20051

1.

.

7.2 12.6 12.1 7.1 0.0 2.0 4.0 6.0 8.0 10.0 12.0 14.0 Percent (%)

White Black Hispanic/Latino Other

1Source: Behavioral Risk Factor Surveillance System; Chronic Disease and Behavioral

Epidemiology; Surveillance – Prevention; Ohio Department of Health, 2006.

Estimated Prevalence of Diabetes by Race and Estimated Prevalence of Diabetes by Race and Gender, Gender, with Odds Ratios (OR), Ohio 2005 Ohio 20051

1.

.

7.4 13.9 7.0 11.8 0.0 2.0 4.0 6.0 8.0 10.0 12.0 14.0 16.0 Percent (%) White Male Black Male White Female Black Female

1Source: Behavioral Risk Factor Surveillance System; Chronic Disease and Behavioral

Epidemiology; Surveillance – Prevention; Ohio Department of Health, 2006.

O.R. = 1.9 O.R. = 1.7

slide-14
SLIDE 14

14

Estimated Prevalence of Overweight, Obesity and Morbid Obesity Among Adult Ohioans by Age Group, 20051.

63% 4% 21% 38%

18+

63% 2% 19% 42%

65+

73% 5% 29% 39%

55-64

69% 5% 24% 40%

45-54

66% 5% 21% 40%

35-44

52% 3% 16% 33%

18-34 Overweight

  • r Obese

Morbidly Obese (BMI 40 or greater) Obese (BMI 30.0-39.9) Overweight (BMI 25.0-29.9) Age (years)

1Source: Behavioral Risk Factor Surveillance System; Chronic Disease and Behavioral

Epidemiology; Surveillance – Prevention; Ohio Department of Health, 2006.

Deaths by broad cause group, Deaths by broad cause group, estimates for 2002 estimates for 2002

I njuries (9.1% ) Communicable diseases, maternal and perinatal conditions and nutritional deficiencies (32.3% )

Total deaths: 57,027,000

Source:WHO, WHR, 2003

Noncommunicable conditions (58.6% ) 72% all NCD deaths are in developing countries

slide-15
SLIDE 15

15

Medical Costs

Obesity

Quality of Life Comorbid Diseases Disability ↑ Mortality ↑

Impact of Obesity Impact of Obesity

Factors Associated with Factors Associated with DiaObesity DiaObesity Pandemic Pandemic

  • Genetic Predisposition

Genetic Predisposition – –Thrifty Gene Thrifty Gene – – Neel Neel’ ’s Hypothesis . Exact genetic marker s Hypothesis . Exact genetic marker (s) is unknown (s) is unknown

  • Increased dense caloric food and less

Increased dense caloric food and less fiber intake fiber intake – –we prefer refined foods we prefer refined foods

  • Decreased physical activity

Decreased physical activity

  • Increased sedentary lifestyle

Increased sedentary lifestyle

  • Intrauterine life (small

Intrauterine life (small vs vs large babies large babies – – intrauterine imprinting intrauterine imprinting-

  • Hale and Barker

Hale and Barker’ ’s s Hypothesis Hypothesis) )

slide-16
SLIDE 16

16

Factors Associated with Factors Associated with DiaObesity DiaObesity Pandemic Pandemic

  • Migration

Migration (international > after 10 yrs) (international > after 10 yrs)

  • Migration

Migration (intra (intra-

  • country rural

country rural urban) urban)

  • Stress

Stress -

  • > HPA axis

> HPA axis --

  • -> high

> high cortisol cortisol --

  • metabolic

metabolic syndrome ( syndrome (Cushingnoid Cushingnoid) ) – – Rat race! Rat race!

  • Socioengineering

Socioengineering and urban development and urban development – –“ “Get Get rid of suburbs and mansions rid of suburbs and mansions” ”

  • Metabolic factors

Metabolic factors – – insulin insulin resistance/ resistance/hyperinsulism hyperinsulism

  • ProInflammation

ProInflammation and and adipocytokines adipocytokines

  • GUT

GUT-

  • NEUROHORMONAL AXIS

NEUROHORMONAL AXIS DYSREGULATION DYSREGULATION

”Food addiction Food addiction” ” and and “ “You are what you eat You are what you eat” ”

Scientific Questions Scientific Questions

What is the role of the What is the role of the adipocyte in the adipocyte in the inflammatory inflammatory-

  • related

related co co-

  • morbidities?

morbidities? What is the role of gut What is the role of gut hormones in obesity hormones in obesity and how does weight and how does weight loss surgery impact loss surgery impact this? this?

  • What is the abnormality in the hormonal milieu that sets

up the vicious cycle of weight gain and regain?

slide-17
SLIDE 17

17

slide-18
SLIDE 18

18

The Diabetes burden threatens The Diabetes burden threatens

To undermine improving To undermine improving standards of living standards of living To hinder education To hinder education To subvert economic growth To subvert economic growth

Obesity contributes more than 50% of Type 2 diabetes

slide-19
SLIDE 19

19

slide-20
SLIDE 20

20

Jack in the Box Bacon Ultimate Cheeseburger 1020 Calories 71 grams of Fat Average American child or teen watches 3-4 hours TV per day Is It Gluttony or Sloth or just that we love to eat? My favorite is Wendy’s Spicy Chicken Combo =1500kcal

Walking the dog-A Physical Activity Rx!

slide-21
SLIDE 21

21

Lifestyle in Transition Lifestyle in Transition

Courtsy of A.Kapur

slide-22
SLIDE 22

22

Lifestyle in Transition Lifestyle in Transition

Courtesy of A.Kapur

WHY ARE WE CONCERNED ABOUT WHY ARE WE CONCERNED ABOUT DIABETES AND ITS LONG TERM DIABETES AND ITS LONG TERM COMPLICATIONS? COMPLICATIONS? 85% of Diabetic Patients die from CVD 85% of Diabetic Patients die from CVD Diabetes is a costly disease Diabetes is a costly disease