Getting your own permit Key Facts for Understanding CTS Start - - PDF document

getting your own permit
SMART_READER_LITE
LIVE PREVIEW

Getting your own permit Key Facts for Understanding CTS Start - - PDF document

Ecology of the California Tiger May 2016 Salamander Workshop Workshop Topics California Tiger Salamander 1) How is the CTS different from other tiger salamanders? Biology and Conservation 2) Where does it occur and what limits its


slide-1
SLIDE 1

Ecology of the California Tiger Salamander Workshop May 2016 Pete Trenham, presenter 1

California Tiger Salamander Biology and Conservation

Presentation Authors: Pete Trenham & Chris Searcy ptrenham@gmail.com

Workshop Topics

1) How is the CTS different from other tiger salamanders? 2) Where does it occur and what limits its distribution? 3) Why has it declined and what are the greatest threats? 4) How to identify the different stages in the CTS life cycle. 5) Life history, demography, and population dynamics. 6) Ecology: habitat attributes, prey, and predators. 7) Movements, metapopulations, and landscapes. 8) Strategies for avoidance, minimization, conservation and recovery 9) Survey methods, requirements, and strategies

Key Facts for Understanding CTS

  • Breed in ponds – develop as aquatic larvae

– ponds must hold water until at least May

  • Larger ponds are better (but not permanent ponds)
  • The CTS is primarily a terrestrial beast

– live in small mammal burrows – observed to move >1.5 km overland

  • Large areas of contiguous or interconnected habitat

is what’s needed for its conservation

– CTS coexist with certain human land uses – Habitat loss (and hybridization) are the main threats

Getting your own permit

  • Start early! It will likely take a year (or more)

– talk to agency representatives throughout process

  • FWS requirements

– B.S. in biology (or equivalent experience) – Course work in herpetology (or eq. exp.) – Study/survey design experience (5surveys/40hrs) – Handling experience (>25, including >5 larve) – Familiarity with habitats – Familiarity with co-occurring amphibians – Ability to identify vegetative components of habitat

What is a CTS

  • Amphibian

– aquatic eggs, thin scale- less skin

  • Salamander

– four legs and a tail

  • Mole salamander

– Family Ambystomatidae

  • Tiger salamander

– large terrestrial salamanders and the only group to occupy grasslands

  • Ambystoma californiense

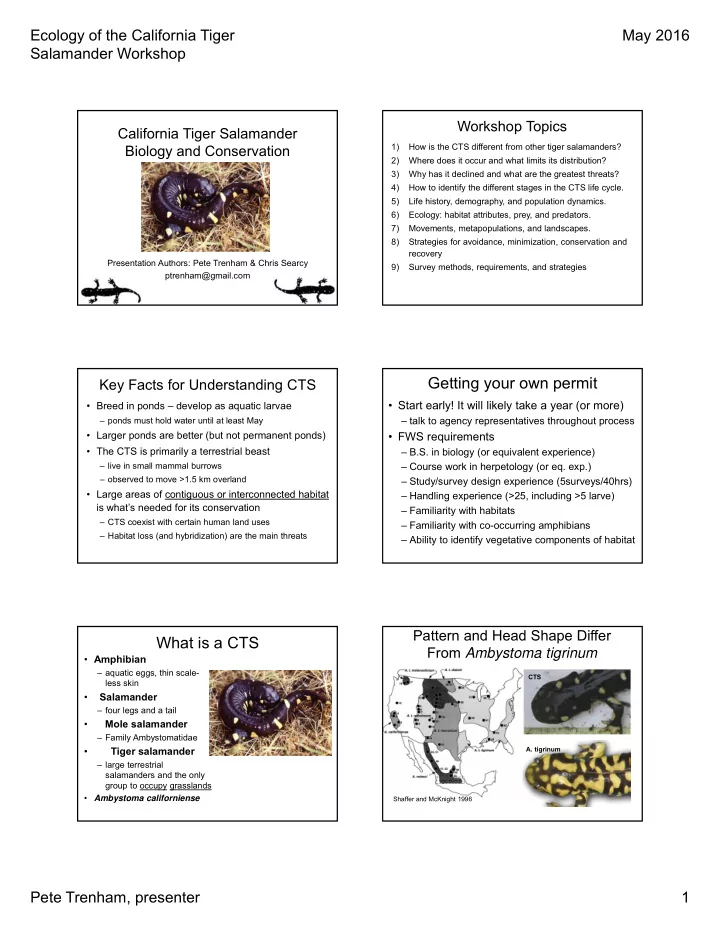
Pattern and Head Shape Differ From Ambystoma tigrinum

CTS

  • A. tigrinum

Shaffer and McKnight 1996

slide-2
SLIDE 2

Ecology of the California Tiger Salamander Workshop May 2016 Pete Trenham, presenter 2

CTS larvae are smaller and are not known to become sexually mature larvae (paedomorphs) CTS

  • A. mavortium

CTS is Genetically Different

(est. 3-5 million years independent evolution)

Shaffer and McKnight 1996

CTS Distribution

  • extremely broad

range

– to 3900 ft in Coast Range – to 1200 ft in Sierra foothills

  • habitat/climate

differs

9 to 38 in rainfall

  • often generalizing

based on studies from a few sites

Focal populations

Hastings Natural History Reservation: 10 years of data (1992-2001) Jepson Prairie Preserve: 9 years of data (2005-2013)

CTS Genetics

Six Genetic Groups Sonoma Central Valley Bay Area Southern San Joaquin Central Coast Range

Santa Barbara

Climatic factors significantly correlated with recruitment

Bioclim variable Sign R2 Annual precipitation + 0.53 Precipitation wettest quarter + 0.33 Minimum temperature of coldest month + 0.28 Mean diurnal range

  • 0.28

Precipitation wettest month + 0.27 Precipitation coldest quarter + 0.22

Searcy, C. A. & H. B. Shaffer 2016. The American Naturalist.

slide-3
SLIDE 3

Ecology of the California Tiger Salamander Workshop May 2016 Pete Trenham, presenter 3

R2 = 0.72 P < 0.001

Annual precipitation Precipitation of wettest quarter Minimum temperature of coldest month Mean diurnal range

Agreement between factors associated with recruitment and spatial distribution

Habitat Basics

  • Aquatic Habitat

– Vernal Pools* – Ponds* – Ditches

  • Upland Habitat

– Grassland* – Oak savanna* – Oak woodlands – Sometimes chaparral and shrublands

Basic Life Cycle and Morphology

Adult Embryos Larva Juvenile/Metamorph

CTS Life Cycle

Sep. Oct. Dec. Nov. Feb. Jan. Apr. Mar. Jun. May Jul. Aug.

Immigrating to pond In pond Emigrating from pond

Breeding Males Breeding Females

Immigrating to pond In pond Emigrating from pond

Juveniles

Travelling between burrows

Young-of-year

Metamorphs emerge from pond Larvae Eggs Pond fills Pond dries Rainy season If pond dries before metamorphosis

  • ccurs, larvae

from that year die

Causes of Decline

  • #1 – Habitat Conversion

– of wetlands and uplands – to cropland, residential and urban uses

  • #2 – Introduced Species
  • #3 – Climate Change?

F-Threatened S-Threatened F-Endangered S-Threatened F-Endangered S-Threatened

*From: CDFG 2009 Status Evaluation

  • CTS Occur On Few

Currently Protected Lands

*From: CDFG 2009 Status Evaluation

slide-4
SLIDE 4

Ecology of the California Tiger Salamander Workshop May 2016 Pete Trenham, presenter 4

Cause of Decline *#2 - Hybrids*

  • initial introduction

– South of Salinas – 1940’s

  • discovered late

1990’s

  • situation evolving

Salinas

Introductory Main Points

  • CTS habitat and range

– Breed in ponds – Upland habitat with grasslands – From Sonoma Co. to Santa Barbara Co., in areas with appropriate climate

  • Annual cycle driven by rainfall and pond

drying

  • Key threats/reasons for listing

– Habitat loss – Hybridization

Embryo Identification/Morphology

  • 2-3mm diameter
  • whitish to grey to

yellow

  • w/jelly 4.5-10mm
  • attached to vegetation
  • r other materials
  • singly or small clusters
  • grape-like (each in its
  • wn separate

membrane)

  • Detectable mainly

Dec-Feb

Shirley Tudor Joseph DiDonato

A B C D E F

Larvae - Identification/Morphology

  • Fish-like
  • Feathery external gills
  • Four legs
  • 30 to 150 mm

– 1 to 6 inches

  • Color variable
  • No stripes or real pattern
  • Potentially detectable

year-round (mainly March-June)

A B C D E F

slide-5
SLIDE 5

Ecology of the California Tiger Salamander Workshop May 2016 Pete Trenham, presenter 5

Adult Identification/Morphology

  • 6-10 inches long
  • NO nasolabial

groove

  • black to light brown

backgound

  • white to light yellow

rounded spots

– size/amount of spots varies

  • toes pointed

– NOT squared

Sexing Adults

  • Males have

longer tail and a swollen vent

  • Females appear

fat when they are gravid with eggs

  • Both sexes have

a laterally compressed tail

Immature Age Classes

  • Metamorphs

– At metamorphosis – Muddy color patterns – Remnant gill stubs – 100-150 mm long

  • 4 – 6 inches

– Fat

  • Juveniles (after 1st

summer)

– Resemble adults, but smaller

A B C D E F

Hybrids

  • Genetic test needed for conclusive ID

– Adults with barring are suspicious – Giant larvae are suspect also (CTS larvae usually <6” total length)

Identification – Main Points

  • Embryos are distinctive and detectable

– Single embryos alone or in clumps

  • Larvae are easily differentiated from newt

larvae by larger size and no eye stripe

  • Metamorphs have muddy/blotchy color

– Often with remnants of gills/fins

  • Juveniles and adults

– Black/brown ground with cream/yellow spots – Lack nasolabial groove, pointed toe tips

  • Hybrid/Natives?

– Genetic test required for conclusive ID – Large size and odd color patterns suggest hybrid

slide-6
SLIDE 6

Ecology of the California Tiger Salamander Workshop May 2016 Pete Trenham, presenter 6

Group Exercise 1 - Identification

  • In a group of 3-4 discuss the different

stages of A. californiense and how you would identify them.

  • What other amphibians might you

encounter in the same ponds?

– What species could cause problems? – In what regions do these species occur?

Timing of Captures: Adults At Ponds

Trenham et al. 2000 (Monterey Co.)

Activity differs by region! Largely driven by rainfall.

Cook et al. 2006 (Sonoma Co.) at pond at pond

Adult/juvenile movement period

Year Start End 05-06 29-Nov 27-Feb 06-07 14-Nov 22-Feb 07-08 11-Nov 20-Feb 08-09 2-Nov 2-Mar 09-10 14-Oct 24-Feb 10-11 24-Oct 2-Mar 11-12 11-Oct 15-Mar 12-13 17-Nov 20-Mar Overall 30-Oct 28-Feb

Positively correlated with date at which annual precipitation reaches 0.56 in. (Jepson Data)

Adult/juvenile movement period

Year Start End 05-06 29-Nov 27-Feb 06-07 14-Nov 22-Feb 07-08 11-Nov 20-Feb 08-09 2-Nov 2-Mar 09-10 14-Oct 24-Feb 10-11 24-Oct 2-Mar 11-12 11-Oct 15-Mar 12-13 17-Nov 20-Mar Overall 30-Oct 28-Feb

Positively correlated with

  • Nov. rainfall,

negatively correlated with

  • Feb. rainfall

(Jepson Data)

Timing Adult Immigration

P = 0.03 R2 = 0.73

Timing Adult Immigration

  • 0.03
  • 0.02
  • 0.01

0.01 0.02 0.03 0.04 10-Jun 18-Sep 27-Dec 6-Apr 15-Jul 23-Oct

Immigration Period Average change in depth (ft/day)

slide-7
SLIDE 7

Ecology of the California Tiger Salamander Workshop May 2016 Pete Trenham, presenter 7

Weather Patterns

1) Even during migratory periods, CTS are active on the surface for a small fraction

  • f the days.

2) Surface activity is driven by weather.

Adult/Juvenile Activity

Year Movement Days 05-06 21 06-07 16 07-08 18 08-09 6 09-10 11 10-11 23 11-12 14 12-13 13 Average 15.25 Out of a ~140 day activity season, 95% of the movement occurs

  • n 15 days (11% of

days)

Correlations

  • Movement days are correlated with:

– Precipitation (+) – High minimum temperature (+) – Humidity (+)

  • However, amongst nights when rain is

predicted (~32 per year), there is no clear rule for when CTS will be active

Metamorph emergence period

Year Start End 04-05 19-May 20-Jun 05-06 30-May 10-Jul 07-08 14-May 20-May 08-09 23-May 10-Jun 09-10 21-May 26-Jun 10-11 2-Jun 30-Jun 11-12 1-Jun 19-Jun 12-13 7-May 18-May Overall 17-May 3-Jul

Positively correlated with Mar. rainfall (Jepson Data)

Metamorph emergence period

Year Start End 04-05 19-May 20-Jun 05-06 30-May 10-Jul 07-08 14-May 20-May 08-09 23-May 10-Jun 09-10 21-May 26-Jun 10-11 2-Jun 30-Jun 11-12 1-Jun 19-Jun 12-13 7-May 18-May Overall 17-May 3-Jul

Positively correlated with drying date of breeding pond (Jepson Data)

Dates of Metamorph Capture

Monterey Co. (1992-1997) Trenham et al. 2000 Contra Costa Co. (1992-1993) Loredo and Van Vuren 1996

slide-8
SLIDE 8

Ecology of the California Tiger Salamander Workshop May 2016 Pete Trenham, presenter 8

Conclusions – To Avoid Migrating Salamanders

Avoid activities that will impede salamander movement in the terrestrial environment: a) after the first ~0.5 inches of rain in the fall until mid-March b) from mid-May until the breeding ponds are dry

Breeding pond occupancy-larvae

Year Start End 05-06 2-Dec 5-Jul 06-07 14-Nov 25-Feb 07-08 11-Nov 17-May 08-09 2-Nov 9-Jun 09-10 12-Dec 25-Jun 10-11 21-Nov 29-Jun 11-12 15-Dec 18-Jun 12-13 17-Nov 17-May Overall 11-Nov 29-Jun

Positively correlated with first 0.82

  • in. after the

end of October (Jepson Data)

Breeding pond occupancy - larvae

Year Start End 05-06 2-Dec 5-Jul 06-07 14-Nov 25-Feb 07-08 11-Nov 17-May 08-09 2-Nov 9-Jun 09-10 12-Dec 25-Jun 10-11 21-Nov 29-Jun 11-12 15-Dec 18-Jun 12-13 17-Nov 17-May Overall 11-Nov 29-Jun

Positively correlated with drying date of breeding pond (Jepson Data)

Conclusions – Avoiding in Ponds

Avoid activities in the aquatic habitat:

  • Once ~0.8 in. have accumulated after

the end of October

  • Until the pond has dried for natural

vernal pools or until late dry season for artificial ponds

Metamorph Activity At Jepson

Year Movement Days 04-05 35 05-06 48 06-07 07-08 1 08-09 5 09-10 34 10-11 30 11-12 12-13 8 Average 17.88889

91% of the movement days are from just 4

  • f the 9 years,

which account for 94% of the metamorphs

slide-9
SLIDE 9

Ecology of the California Tiger Salamander Workshop May 2016 Pete Trenham, presenter 9

Year Average Breeding Date Average Date of Metamorph Emergence Average Number of Days in Pond 05-06 22-Dec 19-Jun 178 07-08 5-Jan 16-May 131 08-09 14-Feb 31-May 106 09-10 21-Jan 6-Jun 136 10-11 10-Jan 16-Jun 157 11-12 15-Mar 11-Jun 88 12-13 14-Dec 12-May 148

Relationship to Hydroperiod

Pond Size Influences Population Size

Ln Pond Area (square meters)

Aquatic Habitat – Important Issues

  • Vernal pools and playa pools (CTS natural habitat)

– Constructed ponds (more common today)

  • Hydroperiod

– Must persist into May (July or August, even better) – Permanent ponds often unsuitable due to predators

  • Pool area and depth

– Bigger pools = more metamorphs – Deeper pools = >hydroperiod

  • Vegetation? Water quality?

– With or without vegetation – Often w/ livestock waste

Aquatic Prey and Predators

  • Prey

– Zooplankton (cladocera, copepods) – Macrocrustaceans (California clam shrimp, vernal pool tadpoles shrimp*) – Insect larvae (corixids, notonectids) – Newt larvae – Pacific chorus frog tadpoles – Snails *endangered prey

  • Predators

– Avocets – Herons – Terns – Garter snakes – Adult newts – Bullfrogs* – Crayfish* – Fish* – Insect larvae (dytiscid beetles, giant water bugs)* *a big problem with permanent ponds!

Radio Tracking CTS

Trenham 2001

CTS habitat - the uplands CTS Live In Small Mammal Burrows

slide-10
SLIDE 10

Ecology of the California Tiger Salamander Workshop May 2016 Pete Trenham, presenter 10

Landscape Habitat Points

  • Major upland habitats – for burrows/migration

– grassland – oak woodland – chaparral/sage scrub

  • Most do not remain near edge of pond

– >1 km is not rare

  • Movement between ponds 1 - 2 km estimated

– 680 m observed - ~800 m genetically estimated – introduced genes show large scale of movement

  • ver generations

FIBER-OPTIC VIDEO courtesy of Michael Van Hattem

Upland Habitat Main Points

  • After metamorphosis, CTS are almost

always underground

  • Occupy mainly ground squirrel and gopher

burrows

– Emerge to move to pond or another burrow – Emerge only at night, usually when raining

  • Aestivation has not been observed
  • Most do not remain near edge of pond

Drift Fence Array

Olcott Lake Round Pond Key drift fence cattle fence preserve boundary

10 m 100 m 200 m 300 m 400 m 500 m 600 m 700 m 850 m 1000 m 10 m 100 m 200 m 300 m 400 m

165 total fences

10 20 30 40 50 60 70 80 90 200 400 600 800 1000 Salamanders per fence Distance from shoreline (m)

Adults Juveniles Metamorphs

Age Classes Are Distributed Differently

0.2 0.4 0.6 0.8 1 1.2 500 1000 1500 2000 2500 3000 3500 Proportion of population Distance from shoreline (m) 50% 504 m

Protecting 50% of the Population

slide-11
SLIDE 11

Ecology of the California Tiger Salamander Workshop May 2016 Pete Trenham, presenter 11

0.2 0.4 0.6 0.8 1 1.2 500 1000 1500 2000 2500 3000 3500 Proportion of population Distance from shoreline (m) 95% 1703 m

Protecting 95% of the Population

Pattern recognition

How far does the average salamander move in a season?

  • Average rate = 150 m/night
  • Most adults are active for 2 to 5 nights during both

immigration and emigration

  • (150 m/night)(3.5 nights) = 525 m
  • This is pretty similar to the 504 m estimate from the

integration method

How far can a salamander move in a season?

  • We know that a rate of 188 m/night is sustainable

for at least 6 nights in a row

  • There are 10 to 19 nights with appropriate weather

conditions during both immigration and emigration

  • (188 m/night)(10 nights) = 1880 m
  • Even in a dry year, a salamander should be capable
  • f migrating 1703 m

Longest observed migration

1989 m

Jepson Study - Conclusions

  • The two methods agree very well.
  • The average adult probably travels ~500 meters from

the pond – almost twice the distance of any of its congeners.

  • There is no reason to doubt that the top 5% of

migrants travel 1703 m or more from the pond edge.

  • The 2092 m buffer currently used by USFWS is within

the ecophysiological capacity of the salamander in most years and is within the 95% confidence interval

  • f the integration method.
slide-12
SLIDE 12

Ecology of the California Tiger Salamander Workshop May 2016 Pete Trenham, presenter 12

Landscape Ecology

– ~20% moved between ponds – Most moved <600 m – Estimated some disperse up to 1 to 2 km

  • Trenham et al.

2001 Ecology

Probability of Dispersal vs. Distance

Source: Trenham, P. C., W. D. Koenig, and H. B. Shaffer. 2001. Spatially autocorrelated demography and interpond dispersal in the salamander Ambystoma californiense. Ecology 82: 3519-3530.

Fort Ord Genetic Evaluation of Recent Migration History

Data suggest grassland and chaparral favored over woodland for migration Wang et al. 2009

How many acres/hectares to protect 95% of CTS?

  • About how many hectares/acres are

encompassed by a pond buffered by 1.7 km?

  • r = 1,703 m
  • hectare = 10,000 m2
  • acre = 2.5 hectares

2

AREA r  

~9,000,000 m2 = ~900 ha = ~2,300 acres

Group Exercise

  • You are responsible for designing habitat

restoration for a failing vineyard in Sonoma County.

  • The property is 500 acres and currently

has no ponds, but CTS breed in ponds on a neighboring property.

  • List at least 5 priority actions for restoring

CTS to this site.

Multi-species conservation

  • Due to their large habitat requirements,

California tiger salamanders can serve as an umbrella species for conservation of vernal pool grasslands in central California.

  • Vernal pools are a bastion for rare California

endemics; 89 other listed species also live within the 2092 m buffer around California tiger salamander breeding ponds.

slide-13
SLIDE 13

Ecology of the California Tiger Salamander Workshop May 2016 Pete Trenham, presenter 13

Spread of Invasive Salamander Genes

Source: Fitzpatrick, B. M. et al. 2010. Proceedings of the National Academy of Sciences.

Distance (km) from original introduction site

Spread of Invasive Salamander Genes

Full hybrid

Source: Fitzpatrick, B. M. et al. 2010. Proceedings of the National Academy of Sciences.

Distance from original introduction site Distance (km) from original introduction site

Spread of Invasive Salamander Genes

Superinvasive Full hybrid

Source: Fitzpatrick, B. M. et al. 2010. Proceedings of the National Academy of Sciences.

Distance (km) from original introduction site

Spread of Invasive Salamander Genes

Superinvasive Pure CTS Full hybrid

Source: Fitzpatrick, B. M. et al. 2010. Proceedings of the National Academy of Sciences.

Distance from original introduction site Distance (km) from original introduction site

Aquatic Community Metrics

Densities of: 1) Chlorophyll 2) Cladocera 3) Copepoda 4) Corixidae 5) Cyzicus 6) Gastropoda 7) Notonectidae 8) Periphyton 9) Pseudacris

1 2 3 4 5 6 7 8 9 Searcy, C. A., et al. 2015. Oikos.

slide-14
SLIDE 14

Ecology of the California Tiger Salamander Workshop May 2016 Pete Trenham, presenter 14

Testing Effects of CTS, Hybrids, and Superinvasives on Pond Communities

  • 4 x 2 factorial
  • Treatments:

– 4 salamander genotypes – 2 larval densities

  • 5 replicates of

each - 40 cattle tanks total

Effects on Community Composition Food Web

Tiger salamander larvae Cyzicus Gastropods Pseudacris Periphyton Cladocera a b a,b a,b a b b b a b b b

Tiger Salamander Prey

P = 0.004 P < 0.001 P < 0.001 Density Density Density Clam shrimp Snail Tadpole

Trophic Cascade

b a a a,b b a a a P < 0.001 P < 0.001 Water flea Periphyton Density Density

Full Hybrids Continue Growing Longer

Treatment: P < 0.001 Date: P = 0.50 Treatment*date: P = 0.01

slide-15
SLIDE 15

Ecology of the California Tiger Salamander Workshop May 2016 Pete Trenham, presenter 15

Conclusions on Hybridization

1) Superinvasives are ecologically most similar to pure CTS. 2) Full hybrids are ecologically similar, but not equivalent, to pure CTS. 3) We could manage habitat by decreasing hydroperiods.

Modeling Population Extinction Risk

  • Key demographic parameters:

– Age at maturity: 1-5+ years – Fecundity: ~ 800 eggs per female – Larval/embryonic survival: 0-10% – Metamorph/Juvenile survival = ~50% – Adult survival = ~70% Demography: Age of Adults Differed Among Five Ponds in Carmel Valley

Proportion of Sample

Trenham (unpub. data)

0.1 0.2 0.3 0.4 0.5 0.6 0.7 Blom Pond Laguna Conejo Windmill Pond Creche Pond Triangle Pond

2-3 4-5 6-7 8+ 4-5 6-7 2-3 4-5 6-7 8+ 2-3 4-5 6-7 2-3 4-5 6-7

  • Modeled probability
  • f extinction most

sensitive to

– 1) *subadult survival – 2) adult survival

  • This emphasizes

importance of minimally disturbed upland habitat

  • Trenham and Shaffer, 2005,

Ecological Applications

Variation in Metamorph Quality

2 4 6 8 10 12 14 16 18

Mean mass at emergence

Searcy, C. A. et al. 2014. Ecology. 2.81-fold variation 2.07-fold variation 2.49-fold variation

Cohorts with higher average mass had higher average survival

P = 0.03 R2 = 0.95

slide-16
SLIDE 16

Ecology of the California Tiger Salamander Workshop May 2016 Pete Trenham, presenter 16

Individuals with higher mass have higher probability of survival

0.1 0.2 0.3 0.4 0.5 0.6 0.7 0.8 0.9 0.5 1 1.5 2 2.5 3 3.5 4 4.5

Survival Probability Mass (g) Juvenile/Adult Survival

1.6 2.7 4.5 7.4 12.2 20.1 33.1 54.6 90

Demography of Average Pond

Area = 1361 m2 Egg Density = 30/m2 Embryonic/larval survivorship = 0.018 Average age at maturity = 3.1 years

Age (yr) 1 2 3 4 5 6 7 8 9 10 11 12 13 Total Mass (g) 8.7 8.0 13.2 17.7 21.1 23.4 24.8 25.7 26.3 26.6 26.8 26.9 27.0 27.0 Fraction mature 0.00 0.00 0.06 0.65 0.91 0.97 0.98 0.99 0.99 0.99 0.99 0.99 0.99 0.99 Survivorship 0.61 0.37 0.60 0.70 0.73 0.75 0.76 0.77 0.77 0.77 0.77 0.77 0.77 0.77 Fertility 336 574 714 796 845 873 890 900 905 909 911 Metamorphs 727 727 Juveniles 441 154 35 6 2 1 639 Adults 10 64 63 49 37 28 22 17 13 10 8 6 327 Individuals 727 441 164 99 69 51 38 29 22 17 13 10 8 6 1693 Eggs 4083 6864 6618 5628 4564 3618 2834 2205 1709 1322 1021 40466

Demography – Main Points

  • Female CTS can produce large numbers
  • f eggs

– but most breeders are at least 3 yrs old – and they don’t breed every year

  • Survival probability is size dependent
  • Some individuals can live 10+ years

– Most don’t ever make it to metamorphosis

  • Population size is much more sensitive to

upland survival than to larval survival

Conservation Strategies

  • Protect occupied landscapes

– Ideally >>1000 acre blocks; minimally 100 acres – With multiple breeding ponds

  • 5+ if possible
  • Some ponds should be larger
  • Maintain/promote habitat connectivity

– Minimize effects of new or improved roads – Maximize natural habitat between ponds – Construct additional ponds

Aquatic Habitat - Managing for CTS

  • Modify/manage ponds to maintain

appropriate hydroperiod

  • Eliminate predators by periodic drying
  • Maintain existing berms/remove excessive

siltation

  • Create additional ponds
  • Allow livestock grazing (esp. vernal pools)

Upland Habitat-Managing for CTS

  • Maintain habitat connectivity between

ponds and uplands AND between ponds

  • Maintain natural habitat, especially near

breeding ponds

  • Maintain burrowing mammal populations
  • Effects of grazing unknown, but

anecdotally positive

slide-17
SLIDE 17

Ecology of the California Tiger Salamander Workshop May 2016 Pete Trenham, presenter 17

Aquatic Sampling

  • Dip nets
  • Minnow

Seine

  • 1/8” mesh or

smaller

  • Move through

the water quickly

  • Neither works

well in deep ponds

Alternate Aquatic Detection Methods

  • Minnow traps (left)
  • Visual embryo surveys

– “egg grid” shown below

Sue Orloff, Ibis Associates (2007)

What if there is no pond on the property?

Drift Fence Sampling - To catch migrating CTS

X Gap Lip not flush to ground

Drift Fences

Aerial View Side View

Drift Fences

buckets

X

Upland Sampling - Drift Fences with Pitfall Traps

First Consideration – Are You In The Range?

(check with agencies for latest range info)

CA Dept. of Fish and Game

Sampling for CTS – CDFW/USFWS Guidance *requirements for a negative determination*

  • 1) Site assessment – assess upland and aquatic

habitat onsite and within 2 km

  • 2) If pond within 2km and upland habitat only…

– Two seasons of drift fence sampling – ≥1 ft tall drift fence w/ pitfalls ≥ 90% site perimeter – Pitfall buckets <33 ft apart, ≥ 2 gallon buckets – Traps opened for rain events Oct. 15 – Mar. 15

  • 3) If potential breeding habitat on-site

– 2 seasons aquatic sampling for CTS larvae

  • Sample >10 days apart in March, April and May
  • Sample using dipnets and seines (if none detected in dipnets)

– One season drift fence sampling as above

  • With drift fences also around potential breeding habitat
slide-18
SLIDE 18

Ecology of the California Tiger Salamander Workshop May 2016 Pete Trenham, presenter 18

USFWS/CDFG Reports

  • Provide Complete Information

– Dates and times sampled – Rainfall/temperature data for area during study period – Records of all animals captured – Photographs of representative specimens – Photographs of sampling apparatus – Records of all communications with USFWS – For aquatic sampling, calculations of the total effort expended/area covered each time

CTS Basics – Final Review

  • Aquatic Habitat – just for breeding

– Good ponds are temporary but dry only after May – Bigger, longer lasting ponds are better

  • Upland Habitat – the rest of their lives

– On land CTS occupy small mammal burrows – Many move hundreds of meters from ponds – Only return to ponds to breed (not even every year)

  • Landscape Considerations

– More ponds = more security against local catastrophes – For connectivity, ponds should be 1-2 km or less apart

  • Weather/Rainfall

– drives migrations and population dynamics