General Obligation Bond Funding for Capital Projects and Survey - - PDF document

general obligation bond
SMART_READER_LITE
LIVE PREVIEW

General Obligation Bond Funding for Capital Projects and Survey - - PDF document

2/9/2016 General Obligation Bond Funding for Capital Projects and Survey Results Funding for capital projects timeline Step Responsibility Date Authorize preliminary steps & project list Council January 2016 Adoption of ordinance


slide-1
SLIDE 1

2/9/2016 1

General Obligation Bond

Funding for Capital Projects and Survey Results

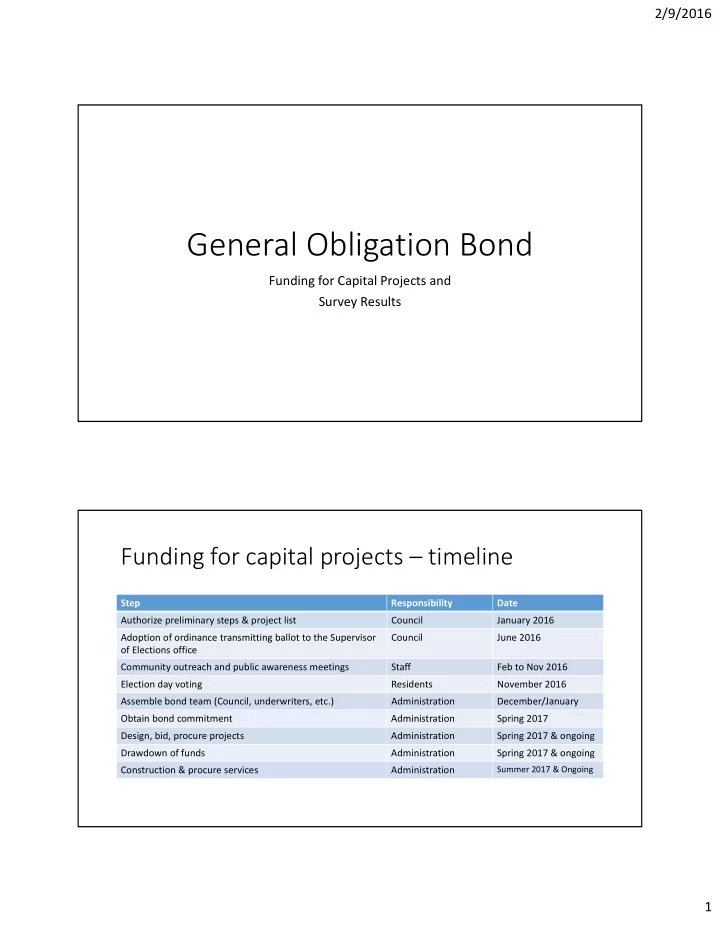
Funding for capital projects – timeline

Step Responsibility Date Authorize preliminary steps & project list Council January 2016 Adoption of ordinance transmitting ballot to the Supervisor

  • f Elections office

Council June 2016 Community outreach and public awareness meetings Staff Feb to Nov 2016 Election day voting Residents November 2016 Assemble bond team (Council, underwriters, etc.) Administration December/January Obtain bond commitment Administration Spring 2017 Design, bid, procure projects Administration Spring 2017 & ongoing Drawdown of funds Administration Spring 2017 & ongoing Construction & procure services Administration

Summer 2017 & Ongoing

slide-2
SLIDE 2

2/9/2016 2

Capital needs – Fire Rescue

Project Project cost Funding source $40 million bond Unfunded Ladder trucks (2) 2,500,000 2,500,000 Fire engines (2) 1,100,000 1,100,000 Fire Station 1 replacement 7,000,000 7,000,000 FS #2 addition (bays for captain and rescue unit) 750,000 750,000 FS#5 addition (training/locker rooms/bathroom/bunk room) 600,000 600,000 TOTAL 11,950,000

Capital needs – Police

Project Project cost Funding source $40 million bond Unfunded Gun range 2,230,000 2,230,000 TOTAL 2,230,000

slide-3
SLIDE 3

2/9/2016 3

Capital needs – Engineering

Project Project cost Funding source $40 million bond Unfunded Park East lighting upgrades 350,000 350,000 Country Club Estates lighting upgrades 150,000 150,000 Plantation Isles/Harbor lighting upgrades 200,000 200,000 Cypress Road sidewalk 100,000 100,000 TOTAL 800,000

Capital needs – Parks & Recreation

Project Project cost Funding source $40 million bond Unfunded Pine Island Park renovations 6,000,000 6,000,000 Sunset Pk/Central Pk lighting 3,700,000 3,700,000 CP Multipurpose center renovations 5,000,000 5,000,000 CP replace 780 building at Parks compound 1,200,000 1,200,000 Pop Travers ballfields renovations 1,200,000 1,200,000 SW 54th Avenue MURT trail 350,000 350,000 Plantation Road MURT trail 300,000 300,000 TOTAL 17,750,000

slide-4
SLIDE 4

2/9/2016 4

Capital needs – Public Works (paving)

Project Project cost Funding source $40 million bond Unfunded Eldorado Estates 800,000 800,000 Royal Palm Estates 1,500,000 1,500,000 Plantation Isles 1,500,000 1,500,000 Jacaranda Lakes 1,600,000 1,600,000 Melaleuca Isles/Sunshine City 400,000 400,000 Plantation Acres (Zones 23 – 26) 5,000,000 5,000,000 SUB‐TOTAL 10,800,000

Capital needs – Public Works (buildings)

Project Project cost Funding source $40 million bond Unfunded Craft shop 720,000 720,000 Grass division equipment 600,000 200,000 400,000 Storage & records 1,800,000 1,800,000 SUB‐TOTAL 3,120,000 TOTAL Public Works 13,920,000

slide-5
SLIDE 5

2/9/2016 5

Capital needs – Storm Water Utility

Project Project cost Funding source Rehab/replace: $40 million bond Storm Water Unfunded Park East 5,200,000 5,200,000 Plantation Historic District 4,150,000 4,150,000 Plantation Park 1,900,000 1,900,000 Plantation Isles/Harbor 2,000,000 2,000,000 Eldorado Estates 400,000 400,000 Royal Palm Estates 600,000 600,000 Headwall replace (3,5,8,9,11,21) 750,000 750,000 Drainage Vac‐truck 400,000 GPS database system & inspect program 440,000 Floodplain mgmt plan 50,000 TOTAL 15,000,000

Summary

Project Project cost Funding source $40 million bond Storm Water Unfunded Total Capital Needs $61,650,000 $40,000,000 14,140,000 8,400,000 TOTAL $61,650,000 $40MM $22,540,000

slide-6
SLIDE 6

2/9/2016 6

Funding for Capital Projects

Survey Results & Analysis

by: Jim Kane, The Florida Voter

slide-7
SLIDE 7

2/9/2016 7

Q.2 40 MILLION BOND ISSUE? * Q.13 RENT OR OWN RESIDENCE Crosstabulation

% within Q.13 RENT OR OWN RESIDENCE

Q.13 RENT OR OWN RESIDENCE Total RENT OWN

Q.2 40 MILLION BOND ISSUE?

FOR 73.9% 57.7% 59.5% AGAINST 21.7% 29.8% 28.9% DK 4.3% 12.5% 11.6% Total 100.0% 100.0% 100.0%

slide-8
SLIDE 8

2/9/2016 8

Q.2 40 MILLION BOND ISSUE? * Q.12 RESIDENCE TYPE Crosstabulation

% within Q.12 REISDENCE TYPE Q.12 REISDENCE TYPE

Total SINGLE FAMILY HOME CONDO TOWNHOUSE APARTMENT OTHER Q.2 40 MILLION BOND ISSUE? FOR 55.7% 69.0% 62.0% 83.3% 100.0% 59.8% AGAINST 33.3% 17.2% 26.0% 5.6% 28.8% DK 11.0% 13.8% 12.0% 11.1% 11.5% Total 100.0% 100.0% 100.0% 100.0% 100.0% 100.0%

Q.2 40 MILLION BOND ISSUE? * Q.10 TIME RESIDENT IN PLANTATION Crosstabulation

% within Q.10 TIME RESIDENT IN PLANTATION

Q.10 TIME RESIDENT IN PLANTATION Total <10 YRS 10-19 YRS 20-29 YRS 30 + YRS Q.2 40 MILLION BOND ISSUE? FOR 67.2% 60.2% 51.6% 55.7% 59.4% AGAINST 20.8% 30.1% 37.6% 30.7% 29.1% DK 12.0% 9.7% 10.8% 13.6% 11.5% Total 100.0% 100.0% 100.0% 100.0% 100.0%

slide-9
SLIDE 9

2/9/2016 9

Q.2 40 MILLION BOND ISSUE? * Q.11 AGE Crosstabulation

% within Q.11 AGE

Q.11 AGE Total 18-30 YRS 31-45 YRS 46-55 YRS 56-65 YRS 66+ YRS Q.2 40 MILLION BOND ISSUE? FOR 73.1% 67.1% 57.9% 55.6% 58.0% 60.1% AGAINST 15.4% 21.9% 32.9% 34.3% 28.6% 28.8% DK 11.5% 11.0% 9.2% 10.1% 13.4% 11.2% Total 100.0% 100.0% 100.0% 100.0% 100.0% 100.0% Q.2 40 MILLION BOND ISSUE? Q.3 UPRGADE FIRESTATION Q.4 PURCHASE 2 FIRETRUCKS Q.5 UPGRADE STATIONS 2&5 Q.6 REPLACE GUNRANGE Q.7 PINE ISLAND PARK Q.8 POP TRAVERS PARK Q.9 RESURFACE ROADS FOR Mean 4.32 4.46 4.17 3.38 3.55 3.43 3.90 N 234 239 235 238 238 229 239

  • Std. Deviation

.939 .924 .951 1.296 1.291 1.250 1.200 AGAINST Mean 2.80 3.02 2.41 1.96 2.39 2.25 2.54 N 116 116 114 112 113 115 115

  • Std. Deviation

1.403 1.582 1.407 1.294 1.404 1.337 1.477 DK Mean 3.55 4.04 3.81 3.02 3.11 3.02 2.86 N 44 45 43 44 44 41 43

  • Std. Deviation

1.150 1.065 1.097 1.355 1.104 1.255 1.187 Total Mean 3.79 3.99 3.62 2.94 3.17 3.04 3.40 N 394 400 392 394 395 385 397

  • Std. Deviation

1.307 1.327 1.363 1.441 1.399 1.378 1.429

slide-10
SLIDE 10

2/9/2016 10

Project “Absolute Must “ Percent Upgrade Fire Station 1 42.4 Purchase 2 Fire Trucks 51.8 Upgrade Fire Stations 2 & 5 37.2 Replace Gun Range 20.05 Enhancements to Pine Island Park 24.3 Renovate Pop Travers Park 20.52 Resurface Roadways Jacaranda/Plantation Isles 32