
SLIDE 1
3.3 4.5 4.4 3.4 3 2.3 0.5 1 1.5 2 2.5 3 3.5 4 4.5 5 2011 for 2016 2012 for 2016 2013 for 2016 2014 for 2016 2015 for 2016 2016 for 2016
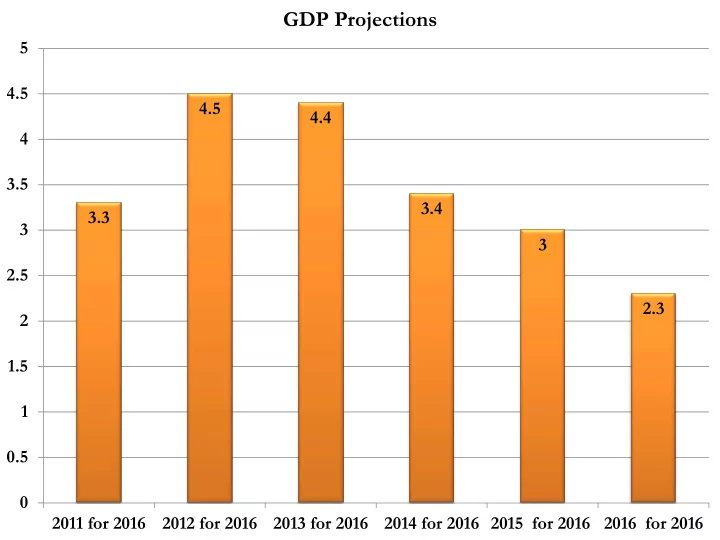
GDP Projections 5 4.5 4.5 4.4 4 3.5 3.4 3.3 3 3 2.5 2.3 - - PowerPoint PPT Presentation
GDP Projections 5 4.5 4.5 4.4 4 3.5 3.4 3.3 3 3 2.5 2.3 2 1.5 1 0.5 0 2011 for 2016 2012 for 2016 2013 for 2016 2014 for 2016 2015 for 2016 2016 for 2016 2011 CBO 10-Year Projected Social Security Trust Fund Balances
3.3 4.5 4.4 3.4 3 2.3 0.5 1 1.5 2 2.5 3 3.5 4 4.5 5 2011 for 2016 2012 for 2016 2013 for 2016 2014 for 2016 2015 for 2016 2016 for 2016
1,000 1,500 2,000 2,500 3,000 3,500 2011 2012 2013 2014 2015 2016 2017 2018 2019 2020 2021 2011 CBO 10-Year Projected Social Security Trust Fund Balances
$Billions
1,000 1,500 2,000 2,500 3,000 3,500 2016 2017 2018 2019 2020 2021 2022 2023 2024 2025 2026 2016 CBO 10-Year Projected Social Security Trust Fund Balances
$Billions
500 1,000 1,500 2,000 2,500 3,000 3,500
$Billions
$Billions
10 20 30 40 50 60 70 80 90 2016 2017 2018 2019 2020 2021
CBO NOW SAYS 2018!
50 100 150 200 250 FY2015 FY2016 FY2017 FY2018 FY2019 FY2020 FY2021 FY2022 FY2023 FY2024 FY2025 FY2026
Medicare Part A Trust Fund Balance
$Billions
Mandatory Spending Discretionary Spending Discretionary Spending Ending Sequestration
($Billions)
($Billions)
Social Security Medicare Medicaid Welfare and Affordable Care Act Veterans Benefits and Services Net Interest Department of Defense--Military Programs Legislative Branch Judicial Branch Department of Agriculture Department of Commerce Department of Education Department of Energy Department of Health and Human Services Department of Homeland Security Department of Housing and Urban Development Department of the Interior Department of Justice Department of Labor Department of State Department of Transportation Department of the Treasury Department of Veterans Affairs Corps of Engineers--Civil Works Other Defense Civil Programs Environmental Protection Agency Executive Office of the President International Assistance Programs National Aeronautics and Space Administration National Science Foundation Office of Personnel Management Small Business Administration Social Security Administration (On-Budget) Social Security Administration (Off-Budget) Other Independent Agencies (On-Budget) Other Independent Agencies (Off-Budget)