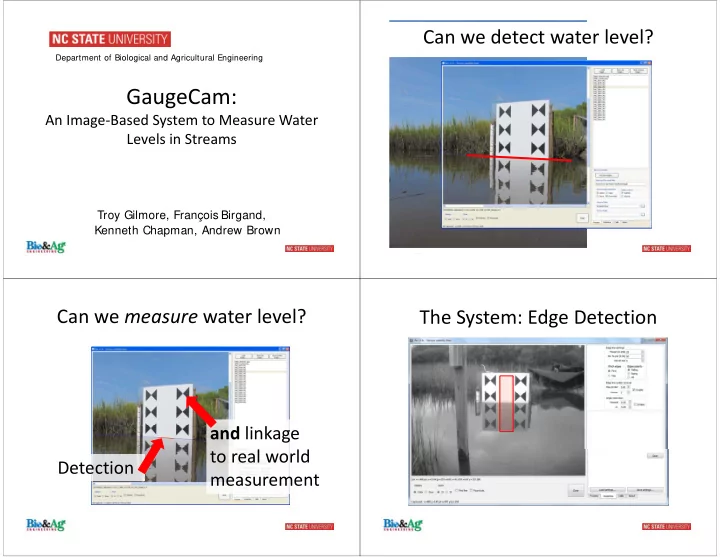
GaugeCam: An Image Based System to Measure Water Levels in Streams - - PowerPoint PPT Presentation

gaugecam
SMART_READER_LITE
LIVE PREVIEW

GaugeCam: An Image Based System to Measure Water Levels in Streams - - PowerPoint PPT Presentation

Can we detect water level? Department of Biological and Agricultural Engineering GaugeCam: An Image Based System to Measure Water Levels in Streams Troy Gilmore, Franois Birgand, Kenneth Chapman, Andrew Brown Can we measure water level? The


slide-1
SLIDE 1

GaugeCam:

An Image‐Based System to Measure Water Levels in Streams

Troy Gilmore, François Birgand, Kenneth Chapman, Andrew Brown

Department of Biological and Agricultural Engineering

Can we detect water level? Can we measure water level?

Detection and linkage to real world measurement

The System: Edge Detection

slide-2
SLIDE 2

The System: Edge Detection The System: Edge Detection The System: Edge Detection The System: Calibration

slide-3
SLIDE 3

The System: Calibration

x = 0 cm, y = 75 cm

Lab Research Objective:

Quantify source and magnitude of uncertainty when measuring water level with images

Uncertainty: Sources

  • 1. Image Resolution
  • 2. Lighting effects
  • 3. Perspective
  • 4. Lens distortion
  • 5. Water meniscus

Uncertainty: Three Experiments

  • 1. Image Resolution
  • 2. Lighting effects
  • 3. Perspective
  • 4. Lens distortion
  • 5. Water meniscus

Benchmark II Benchmark I Water Level

slide-4
SLIDE 4

Uncertainty: Three Experiments

  • 1. Image Resolution
  • 2. Lighting effects
  • 3. Perspective
  • 4. Lens distortion
  • 5. Water meniscus

Benchmark I

Uncertainty: Benchmark I

v v v v

Uncertainty: Benchmark I

v v v v

0.25 cm/pixel 0.5 cm/pixel

Uncertainty: Benchmark I

slide-5
SLIDE 5

Uncertainty Calculation

  • Many images per resolution
  • Error = measured – known value
  • Calculated distribution of errors

for each resolution

  • Calculated bias, SD and RMSE of

each distribution

Benchmark I: RESULTS

cm per pixel Lo res High res Mean Bias, SD, RMSE (cm)

Benchmark I: RESULTS

~ 5 m 16 mm lens ~ 7 m 16 mm lens

cm per pixel Mean Bias, SD, RMSE (cm)

Uncertainty: Three Experiments

  • 1. Image Resolution
  • 2. Lighting effects
  • 3. Perspective
  • 4. Lens distortion
  • 5. Water meniscus

Benchmark II Benchmark I

slide-6
SLIDE 6

Benchmark II

Lens Distortion Lighting (Bloom)

Uncertainty: Sources

Perspective

Benchmark II: RESULTS

Night RMSE Day RMSE Std Dev Mean Bias

cm per pixel Mean Bias, SD, RMSE (cm)

Benchmark II: RESULTS

4 m 12 mm lens

cm per pixel Mean Bias, SD, RMSE (cm)

5 m 6 m 7 m

slide-7
SLIDE 7

Uncertainty: Three Experiments

  • 1. Image Resolution
  • 2. Lighting effects*
  • 3. Perspective
  • 4. Lens distortion
  • 5. Water meniscus

Benchmark II Benchmark I Water Level

Uncertainty: Camera effects

Lighting* Meniscus Effects

Water Level: RESULTS

4m, 12 mm 5 m 6 m 7 m

cm per pixel Mean Bias, SD, RMSE (cm)

Water Level: Posture Angle

19 deg 10 deg

For camera at 6 meters

slide-8
SLIDE 8

Water Level: 6m, 16mm lens

posture angle from horizontal (degrees)

19 10

Bias (cm)

Conclusions

1. Lens distortion must be minimized 2. Posture angle may interact with meniscus 3. With reasonable precautions, accuracy of +/‐ 3 mm (0.01 ft) is achievable in the lab

Acknowledgements

Salt Marsh Images: Randall Etheridge, Brad Smith Lab Analysis Assistance: Kelly Chapman Camera Equipment: www.Microseven.com www.Colorado‐Video.com Software: www.GaugeCam.com Check out our ASABE 2011 booth!

Louisville Belle waterline