
SLIDE 1
Gas mass conversion factors
1
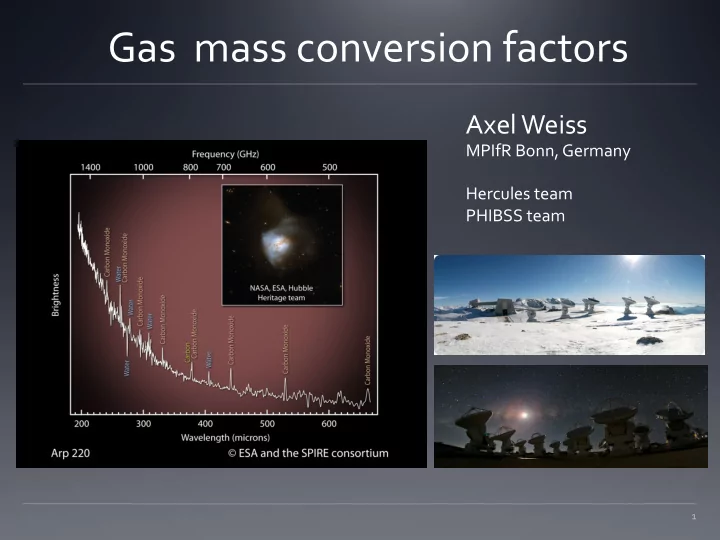
Axel Weiss
MPIfR Bonn, Germany Hercules team PHIBSS team
Gas mass conversion factors Axel Weiss MPIfR Bonn, Germany - - PowerPoint PPT Presentation
Gas mass conversion factors Axel Weiss MPIfR Bonn, Germany Hercules team PHIBSS team 1 Motivation Daddi ea 2010 Scoville ea 2016 L 850 /L CO(1-0) =0.8 MW Today we have much better data to reevaluate molecular gas mass conversion
1
MPIfR Bonn, Germany Hercules team PHIBSS team
Motivation
2
Daddi ea 2010 Scoville ea 2016
α=0.8 αMW Today we have much better data to reevaluate molecular gas mass conversion factors! (CO SEDs, good dust continuum coverage, information from other lines like CI in larger samples of galaxies)
3
‘Hot Boltzmann tail’ Multi-component ISM versus 500-2000K 103 cm-3 105 cm-3 104 cm-3
4
Parameters: Physical
2 )
Chemical
Radiation Field:
Dust and gas are linked at several levels:
dust opacity
N(H2)/dv ~ n(H2) δv/δr -1
*[mol]/[H2] => line opacity
N(H2) = N(H2)/dv dvturb * GDMR => dust opacity M(H2) = Ωs N(H2)
(Weiss ea 2007)
5
Column density for a turbulent ISM (simulation) Density distribution is log normal Tkin ~ n(H2)-γ (hydro sim) n(H2), Tkin Tdust Ω, [CI] Numbers: dvturb κvir GDMR, [CO] Distribution: low dvturb high dvturb
e.g. Krumholz & McKee 2005, Goldbaum ea 2016
6
Distribution: Σgas (r) => n(H2) (r) Tkin Tdust, Ω Numbers: dvturb κvir chemical params
Each component is the result from the turbulence model with <n(H2)> , <Tkin> and Ωsource from the exponential disk distribution
7
High-z QSOs and SMGs
(submm selection, above the MS)
z=2.0 – 6.3 6 SBs; 6 QSO hosts CI: 8
Hercules : local (U) LIRGs 26 galaxies CI for 21 Total 44 (U)LIRG
9 High-z MS galaxies
(z~2, NIR selection) Log M* =10.5- 11.8 CI: 4
2 comp. turb.
Rosenberg ea 2015 e.g Weiss ea 2005, 07 Walter ea 2011 Daddi ea 2010/15 Tacconi ea 2013 Genzel ea 2015
8
2C: αco = 4.0 +/- 1.1 Msol (K km/s pc2)-1 T: αco = 4.9 +/- 1.9 Msol (K km/s pc2)-1 TD: αco = 4.0 +/- 0.7 Msol (K km/s pc2)-1 Xco = 1.9 +/- 0.3 x 1020 cm-2 ( K km/s)-1
Calibration for inner part of the MW ( |2.5| < l < |32.5|)
Bolatto ea 2003
(Incl. He correction)
(Fixsen ea 1999) (Fixsen ea 1999) Planck, IRAS
(turbulent disk model; preliminary)
10
Turbulent Disk model GN20 @ z =4.05 Limits on αco from Mdyn: αco < 3.3 Msol (K km/s pc2)-1 we find: αco : 2.2 +/ -0.8 Msol (K km/s pc2)-1 Hodge ea 2015 Radial profile model (example) vs observations 170µm rest continuum CO(2-1)
11
Turbulent Disk model SMM14011 @ z =2.5 Difference compared to Σ(H2) implies that ALL conversion factors change with r!