
GAP GYAN
A GLOBAL JOURNAL OF SOCIAL SCIENCES
( ISSN – 2581-5830 ) Impact Factor – 4.998
GAP GYAN – VOLUME - III ISSUE I MARCH - 2020
https://www.gapgyan.org/
76 THE TAYLOR RULE OF MONETARY POLICY AND ITS IMPLICATIONS- A GRAPHICAL PRESENTATION
- Dr. Satyajeet S Deshpande
Principal, J G College of Commerce, Ahmedabad
Abstract
The current paper attempts to present the famous Taylor rule relating to the real rate of interest during high
- inflation. The rule tells us about the direct relationship between the inflation rate and the real rate of interest.
Since the real GDP is inversely related to the real interest rate, a high rate of inflation indirectly causes the real GDP to fall. The paper is divided in to four sections. The first section describes the Taylor or Monetary policy rule. The second section shows the outcome of the Taylor rule on the various components of aggregate expenditure like consumption, investment and net exports. The third section graphically presents the inverse relation between the rate of inflation and real GDP. The final section illustrates the implication of these inter-connections to the
- economy. The paper makes extensive use of graphs and charts to show relationships between different variables.
Key Words: Taylor Rule, Monetary Economics, Real Rate of Interest, Rate of Inflation, Real GDP
- 1. MEANING OF TAYLOR RULE
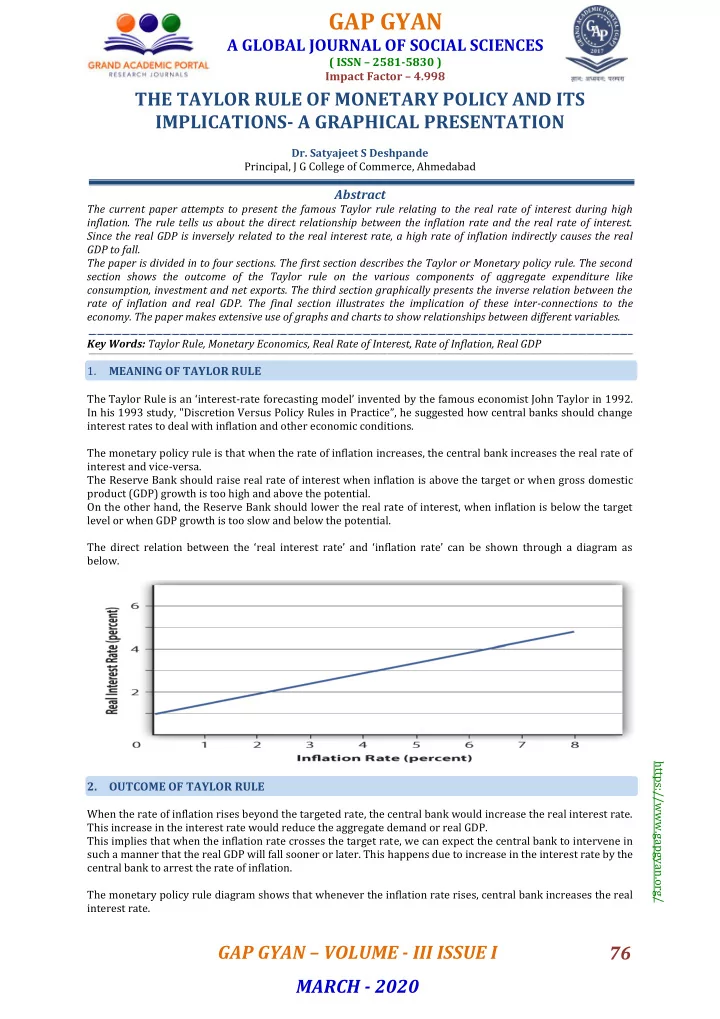
The Taylor Rule is an ‘interest-rate forecasting model’ invented by the famous economist John Taylor in 1992. In his 1993 study, "Discretion Versus Policy Rules in Practice”, he suggested how central banks should change interest rates to deal with inflation and other economic conditions. The monetary policy rule is that when the rate of inflation increases, the central bank increases the real rate of interest and vice-versa. The Reserve Bank should raise real rate of interest when inflation is above the target or when gross domestic product (GDP) growth is too high and above the potential. On the other hand, the Reserve Bank should lower the real rate of interest, when inflation is below the target level or when GDP growth is too slow and below the potential. The direct relation between the ‘real interest rate’ and ‘inflation rate’ can be shown through a diagram as below.
- 2. OUTCOME OF TAYLOR RULE
When the rate of inflation rises beyond the targeted rate, the central bank would increase the real interest rate. This increase in the interest rate would reduce the aggregate demand or real GDP. This implies that when the inflation rate crosses the target rate, we can expect the central bank to intervene in such a manner that the real GDP will fall sooner or later. This happens due to increase in the interest rate by the central bank to arrest the rate of inflation. The monetary policy rule diagram shows that whenever the inflation rate rises, central bank increases the real interest rate.