
SLIDE 1
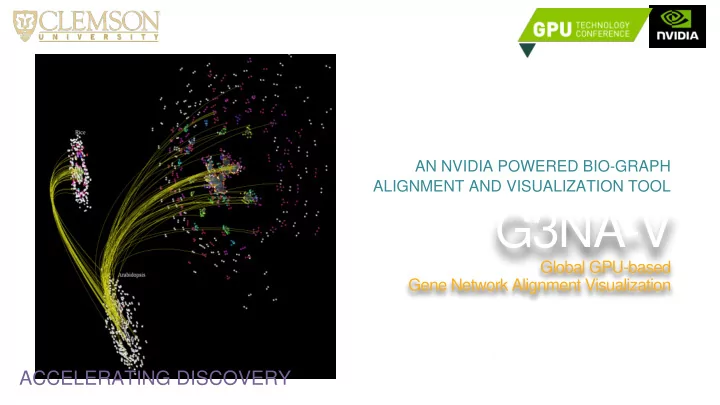
G3NA-V
Global GPU-based Gene Network Alignment Visualization
AN NVIDIA POWERED BIO-GRAPH ALIGNMENT AND VISUALIZATION TOOL
Karan Sapra
Melissa C. Smith, Alex Feltus, Joshua Levine
ACCELERATING DISCOVERY
G3NA-V Global GPU-based Gene Network Alignment Visualization Karan - - PowerPoint PPT Presentation
AN NVIDIA POWERED BIO-GRAPH ALIGNMENT AND VISUALIZATION TOOL G3NA-V Global GPU-based Gene Network Alignment Visualization Karan Sapra Melissa C. Smith, Alex Feltus, Joshua Levine ACCELERATING DISCOVERY Problem Statement World Population
Global GPU-based Gene Network Alignment Visualization
AN NVIDIA POWERED BIO-GRAPH ALIGNMENT AND VISUALIZATION TOOL
Karan Sapra
Melissa C. Smith, Alex Feltus, Joshua Levine
ACCELERATING DISCOVERY
Problem Statement
Crop Yield World Population Estimates Cancer and other Infectious Diseases “Human Prosperity depends on our ability to understand genomes of
Overview of Genomic Discoveries
Construct Gene Expression Identify Modules Relate Modules using External information Sequencing and Sampling Collecting multiple Samples from tissues
from organism, etc. Correlation, Topological Analysis, thresholding, clustering Network Alignment (G3NA) Utilize GO Ontology, Evolutionary Tree, Molecular Structure
Conserved Graph Alignment (Compute ) Clustering and GUI Ontologies Molecular Visualization Multi Network Alignment Gene Expression Network Gene Expression Matrix Sample Curve Distribution Evolutionary Tree
ACCELERATING DISCOVERY
Complex biological systems can be modeled as graphs…
Rice graph mapped to genome
Genenet Engine: sysbio.genome.clemson.edu
Higher Yield!!!!
Edge (Gene Interaction) Node (Gene)
Alzheimer’s (Plaque in Brain)
Aligned Graphs
Paleogenomics: Conserved subgraphs can be detected by graph alignment…
Conserved Subgraphs Evidence: Maize-Rice Ancestor Shared Similar Gene Interaction Patterns 50-70 Millions of Years Ago
Ficklin & Feltus "Gene coexpression network alignment and conservation of gene modules between two grass species: maize and` rice." Plant Physiology 156:3 (2011)
Maize Rice
Conserved Graph Alignment (Compute ) Clustering and GUI Ontologies Molecular Visualization Multi Network Alignment Gene Expression Network Gene Expression Matrix Sample Curve Distribution Evolutionary Tree
ACCELERATING DISCOVERY
Compute Engine Visualization Engine
Preprocessing Network Alignment Postprocessing Graph Algorithm Edge and Cluster Matching Node Matching Visualization(Graph, Molecule, Matrix, etc) Update Visualization Apply Filtering
tcp mpi
shared-memory
Daemon (Message Passing Control Unit)
reduction, ray-casting, Parsing, etc.
Node GPU GPU Super Daemon Node GPU GPU Daemon Node GPU GPU Daemon
Network Aligner (G3NA)
Maize Rice Alignment Graph Maize - Rice
non-utilized information
Cluster File Network Information File
and input of graph and supporting data
space
Information between graphs
{ "graph": { c "graph1": { "id": 1, "name": "Maize", "fileLocation": "M.tab", "clusterLocation": "M.tab.cluster", "Ontology": "Maize_info2.txt", "x": -300, "y": 0, "z": 0, "w": 200, "h": 200 }, "graph2": { "id": 2, "name": "Rice", "fileLocation": "R.tab", "clusterLocation": "R.tab.cluster", "Ontology": "Rice_info2.txt", "x": 0, "y": 0, "z": 0, "w": 200, "h": 200 } }, "alignment": { "alignment1": { "graphID1" : 1, "graphID2" : 2, "filelocation" : “output.gna”} } }
http://network.genome.clemson.edu
Enabling Systems Genetics using HPC
Clemson University
721.9 Teraflops 2021 Compute Nodes and 22,336 cores 374 nodes with dual K20/K40 for acceleration and visualization 56Gbit interconnect
Gene Expression Matrix Sample Curve Distribution
genes associated to a species and a number of Samples
value expressed by the gene
as a heatmap
distribution identify
genomic expression data.
histogram of intensities with the range [-1, 1].
Multi Network Alignment Gene Expression Network Gene Expression Matrix Sample Curve Distribution
Performance with IsoRankN G3NA Scalability
All Performance data are from single node K40
All Performance data are from single node K40
to multiple GO terms
an ontology
GO terms (and descriptions)
structure for each gene node
Data Bank archive (PDB)
Ebola Virus Antibody 114
and networks related information