
FY19 General Fund 100 Budget Summary
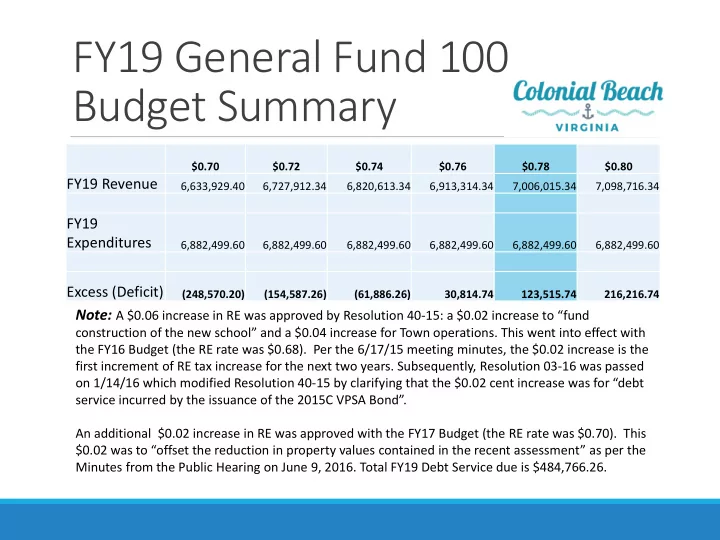
$0.70 $0.72 $0.74 $0.76 $0.78 $0.80
FY19 Revenue
6,633,929.40 6,727,912.34 6,820,613.34 6,913,314.34 7,006,015.34 7,098,716.34
FY19 Expenditures
6,882,499.60 6,882,499.60 6,882,499.60 6,882,499.60 6,882,499.60 6,882,499.60
Excess (Deficit)
(248,570.20) (154,587.26) (61,886.26) 30,814.74 123,515.74 216,216.74
Note: A $0.06 increase in RE was approved by Resolution 40-15: a $0.02 increase to “fund
construction of the new school” and a $0.04 increase for Town operations. This went into effect with the FY16 Budget (the RE rate was $0.68). Per the 6/17/15 meeting minutes, the $0.02 increase is the first increment of RE tax increase for the next two years. Subsequently, Resolution 03-16 was passed
- n 1/14/16 which modified Resolution 40-15 by clarifying that the $0.02 cent increase was for “debt
service incurred by the issuance of the 2015C VPSA Bond”. An additional $0.02 increase in RE was approved with the FY17 Budget (the RE rate was $0.70). This $0.02 was to “offset the reduction in property values contained in the recent assessment” as per the Minutes from the Public Hearing on June 9, 2016. Total FY19 Debt Service due is $484,766.26.