
SLIDE 1
May 2019
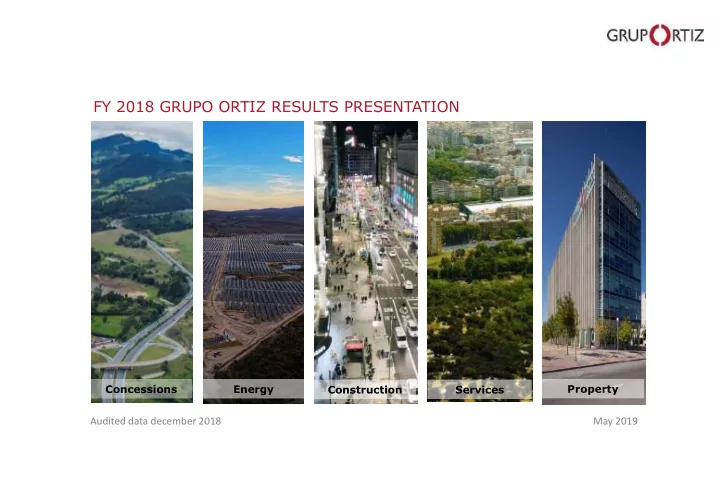
FY 2018 GRUPO ORTIZ RESULTS PRESENTATION
Energy Concessions Construction
Audited data december 2018
Property Services
FY 2018 GRUPO ORTIZ RESULTS PRESENTATION Concessions Energy - - PowerPoint PPT Presentation
FY 2018 GRUPO ORTIZ RESULTS PRESENTATION Concessions Energy Construction Services Property Audited data december 2018 May 2019 INDEX 1. Revenues and EBITDA Pg 3-6 2. Grupo Ortiz Description Pg 7-8 3. Consolidated Results Pg 9-10 4.
May 2019
Energy Concessions Construction
Audited data december 2018
Property Services
2
1. Revenues and EBITDA Pg 3-6 2. Grupo Ortiz Description Pg 7-8 3. Consolidated Results Pg 9-10 4. Grupo Ortiz Internationalisation Pg 11-13 5. Current backlog and 2019 estimated revenues Pg 14-15 6. Grupo Ortiz REITs (SOCIMI) Pg 16-18 7. Energy división Pg 19-21 8. Concessions división Pg 22-23 9. International Construction division Pg 24-26
Pg 27-28
Pg 29-31
Pg 34-35
Pg 34-35
Pg 36-38
Pg 39-40
3
4
Amount
Change
2017-2018
478,05 509,87 523,33 392,21 412,40 376,30 347,20 429,20 605,31 2010 2011 2012 2013 2014 2015 2016 2017 2018
Figures in millions of euros.
2018 Audited Data.
5
Figures in millions of euros.
* Includes the data of concessions not consolidated in the financial statements (equity-accounted).
2018 Audited Data.
REVENUES IN 2018 % 2017-18 EBITDA IN 2018 BUSINESS AREA DOMESTIC CONSTRUCTION 117.90 +7% 3.07 INTERNATIONAL CONSTRUCTION 89.94 +31% 4.40 SERVICES 62.50 +1% 3,05 DOMESTIC ENERGY 13,24 +23% 0.45 INTERNATIONAL ENERGY 309.04 +89% 13.23 PROPERTIES 2.77 +25% 13.00 DEPENDENT CONCESSIONS 9.92 +6% 2.17
TOTAL CONSOLIDATED GROUP 605.31 +41% 39.37
+ NON-DEPENDENT CONCESSIONS 30.20
20.30 + REIT 3.92
TOTAL GROUP (*) 639.43 +35% 61.57
DOMESTIC CONSTRUCTION
18%
INTERNATIONAL CONSTRUCTION
14% 14%
SERVICES10% DOMESTIC ENERGY 2% INTERNATIONAL ENERGY 48% PROPERTY
1%
CONCESSIONS7% DOMESTIC CONSTRUCTION 5% INTERNATIONAL CONSTRUCTION 7% SERVICES 5% DOMESTIC ENERGY
1%
INTERNATIONAL ENERGY
23%
PROPERTY
22%
CONCESSIONS
37%
6
2018 Audited Data.
50 100 150 200 250 300 350 2013 2014 2015 2016 2017 2018 Domestic construction International construction Services Energy Rental Concessions
7
A consolidated perimeter that generates €39.37 Mn EBITDA, mainly from the Energy, Construction and Services areas
8
A NON‐consolidated scope comprising investment share capital in concessions and rental properties with a carrying amount of €107.23Mn
In 2018, these stakes generated an additional EBITDA to the consolidated amount of €8.89 Mn,with recurring EBITDA of €3.92M interest(dividend + interest on the subordinated debt) and a book profit of €4.97Mn arising from divestments
EBITDA GRUPO 48,26 M€
CON ONSO SOLIDATED SCOPE PE NON‐CONSOLIDATED SCOPE
REVENUES IN 2018
EBITDA
BUSINESS AREA DOMESTIC CONSTRUCTION 117.90
3.07
INTERNATIONAL CONSTRUCTION 89.94
4.4
SERVICES 62.50
3.05
DOMESTIC ENERGY 13.24
0.45
INTERNATIONAL ENERGY 309.04
13.23
RENTAL 2.77
13.00
DEPENDENT CONCESSIONS 9.92
2.17
TOTAL CONSOLIDATED GROUP 605.31 39.37
EQUITY-ACCOUNTED CONCESSIONS EQUITY (CARRYING AMOUNT) DOMESTIC 33,62 THERMOSOLAR PLANT 17.6 TOLL ROAD 5.81 TOLL ROAD 3.37 BULEVAR ARTE y CULTURA 1.43 ORTIZ SPORT FACTORY 4.80 ALTEN EL CASAR PV PLANT 0.61 INTERNATIONAL 35.92 TEPIC HOSPITAL (MEXICO) 4.62 CONEXIÓN NORTE ROAD (COLOMBIA) 9.99 TRANSVERSAL DEL SISGA ROAD (COLOMBIA) 15.13 ALTEN AMERICA PV PLANT 5.70 MEDSOLAR 0.48 TOTAL CONCESSIONS 69.54
RENTAL EQUITY (CARRYING AMOUNT) GOP REIT 37.69
TOTAL RENTAL
37.69
2018 Audited Data.
Figures in millions of euros.
9
10
Datos en Millones de euros. 2018 Audited Data.
PL ACCOUNT CONTINUING OPERATIONS 2.018 2.017 Revenues 605.305 429.202 OPERATING PROFIT/(LOSS) 33.372 25.168 Financial income 3.548 4.081 Financial expenses (19.010) (18.754) Changes in the fair value of financial instruments (1.010) (213) Exchange differences (7.945) 1.489 Impairment and gains / (losses) on disposal of financial instruments (246) (11) FINANCIAL RESULT (24.663) (13.408) Profit/ (Loss) from companies accounted using the equity method 3.582 1.229 Impairment and gains/ (losses) on the loss of significant influence over companies accounted using the equity method 4.970 895 Negative consolidation difference of companies accounted using the equity method
PROFIT/(LOSS) BEFORE TAXES 17.261 15.600 Corporate profit tax (2.896) (5.251) Financial Year consolidated profit/ lss from continuous operations 14.365 10.349 DISCONTINUED OPERATIONS Financial Year consolidated profit/ lss from interrumted operations 1.352 6.841 CONSOLIDATED RESULT 15.717 17.190
11
12 INTERNATIONAL EXPANSION STRATEGY:
legal certainty (Colombia, Peru, Panama and Mexico).
(Japan, Chile, Honduras, Guatemala, El Salvador and Mexico).
▪ Group's international revenue: 66% ▪ International revenue in the Energy area: 96% ▪ Group investment: 100% International
Implemented in the country Country with energy and hospital projects.
MEXICO ENERGY CONSTRUCTION CONCESSIONS PANAMA WATER TREATMENT CONSTRUCTION COLOMBIA CONCESSIONS CONSTRUCTION WATER TREATMENT PERU CONSTRUCTION WATER TREATMENT ENERGY: CHILE ENERGY * ITALY ENERGY ROMANIA WATER TREATMENT JAPAN ENERGY EL SALVADOR ENERGY GUATEMALA ENERGY HONDURAS ENERGY BOLIVIA CONSTRUCTION
▪ Group's international revenue: 69% ▪ International revenues in the Energy area: 95%
2018 E2019
100 200 300 400 2010 2011 2012 2013 2014 2015 2016 2017 2018
International construction International energy
Fi Figures s in mill illion
s of
Unaudited data. International revenue in 2018 ESTIMATE FOR 2019 Peru 14.08 19.67 Colombia 37.05 85.00 Mexico 248.44 273.16 Panama 35.18 41.00 Bolivia 2.60 11.00 Japan 22.83 43.03 Honduras 30.64
4.72 5.15 Other 3.40 6.50 TOTAL 398.94 484.51 Spain 205.31 216.62 TOTAL 605.31 701.13 *Unaudited data (in millions of euros)
13
* Includes the data of concessions not consolidated in the financial statements (equity-accounted).
▪ Awarded total current backlog : €5,551Mn. ▪ International backlog : 78% of the total backlog (59% in Construction and 80% in Energy).
14
PROJECTED 2019 REVENUES FROM THE CURRENT PORTFOLIO IN THE AREAS OF DOMESTIC CONSTRUCTION + SERVICES, INTERNATIONAL CONSTRUCTION AND ENERGY
% Backlog to be executed in 2019 Projected 2019 revenues based
+11%
178 185 298
100 200 300 400 500
Domestic CONSTRUCTION + Services International CONSTRUCTION Domestic + international ENERGY
60% 46% 61%
295,50 409,96 441,30 51,18 4.933 278,92 401,93 487,86 46,05 4.336 Domestic CONSTRUCTION + Services International CONSTRUCTION Domestic + international ENERGY RENTAL CONCESSIONS (*) BACKLOG IN 2017 CURRENT BACKLOG
2018 december audited data. Figures in millions of euros.
15
ESTIMATED 2019 REVENUES
REVENUES IN 2019
% 2018-19
BUSINESS AREA DOMESTIC CONSTRUCTION 121.44
+3%
INTERNATIONAL CONSTRUCTION 172.16
+91%
SERVICES 63.00
+1%
DOMESTIC ENERGY 18.10
+37%
INTERNATIONAL ENERGY 312.90
+1.35%
RENTAL 2.20
DEPENDENT CONCESSIONS 11.33
+14%
TOTAL CONSOLIDATED GROUP 701.13 21%
+ NON-DEPENDENT CONCESSIONS 33.15
+ REIT (SOCIMI) 4.32
+10%
TOTAL GROUP (*) 738.60
+16%
DOMESTIC CONSTRUCTION 16% INTERNATIONAL C0NSTRUCTION
23%
SERVICES 9% DOMESTIC ENERGY 2% INTERNATIONAL ENERGY
43%
PROPERTIES
1%
CONCESSIONS
6%
Expe Expected revenue gr grow
20 2017 17 vs 20 2019 19: +6 +63% 3%
Fi Figures s in mill illion
s of
16
17
✓ 2018 profit: €10.83Mn. ✓ Total shareholder profitability in 2018: 15 15.36%
5.66 66% through cas ash
9.70 70% through asset t revalu luatio ions ✓ Quarterly distribution: 5. 5.66 66%.
✓ Asset valuation increase in 2018: €169.26Mn
6.02 02% in 2018
12.27% through accumulated revaluations ✓ Share price increase in 2018: €15.60/share (+4%)
✓ Revenues = €8. 8.10 10Mn (+ 4.2%) ✓ EBITDA = €12.7Mn (including asset revaluations) ✓ Rental = 98% 98%.
✓ Ortiz = 48 48.81% ✓ Institutional investors = 22 22.29% ✓ 130 investors = 28% 28%
Fi Figures s in mill illion
s of euros
67,39 44,47 18,32 16,20 3,89 73,90 50,62 21,78 18,19 4,78
0,00 10,00 20,00 30,00 40,00 50,00 60,00 70,00 80,00
OFFICES HOMES ORTEGA Y GASSET CAR PARK COMMERCIAL AND PARKING SPACES WAREHOUSES
Asset valuation initial-current (millions of euros)
Initial appraisal Current appraisal
Current valuation: €169.26Mn
18
Fi Figures s in mill illion
s of euros
19
20
720
Pho hoto tovolta ltaic ic pr proj
ts: 7 Tota
power wer: 992 992 MWp
Award of oi
plant.
Mexico
Projects ts: 1 line and 2 substations Tota
power wer: 138 kV
Peru
Pho hoto tovolta ltaic ic pr proj
ts: 2 Tota
power wer: 58MWp Completed projects.
Guatemala and Honduras
Pho hotovol
proj
ects: 3 Total po power: 51 MWp
Spain
Pho hoto tovolta ltaic ic pr proj
ts: 1 Tota
power wer: 13 MWp Start of EPC 1st quarter 2019
Japan * Including EPC work for clients and/or concessions
21
Engi gineering.
Purch chases.
ORT RTIZ EN ENERGÍA COMPREHENSI SIVE PR PROJECT MANAGEMENT
gineering.
ction.
ORTIZ CONSTRUCCIONES
Engi gineering.
ction.
Purch chases.
JUAN GALINDO
Ex Experience in n TL & sub ubstations:
distr tribution: : 600 km.
ubstations (20-400 KW) W) > > 20. Ex Experience in n ph photo tovoltaic pl plants:
MWp.
proje
cts.
Ope peration & Ma Mainte tenance. Ex Experience in n O&M:
MWp.
proje
cts.
7 cou
Har Harnessing Grou
Accredit ited exp xperie ience ELE LECOR
22
ENERGY
Colo
ia
Con
te ro road. Tra ransversal de del Sis Sisga toll roa road: Financial closing and sale (€17,8Mn) COFIDES in Nov
18
mplementation of
Ruta Ruta Caribe ro road (474 km) expected to start in Jun. 19
Mexic ico
Ho Hospital in n Tepic, 150 beds, for ISSSTE
ey scru rubs
mplementation in n Sep. 19 2 ro roads.
biza airport (7.8 km) and the A3 A31 Bonete-Alicante (111 km). Ene Energy.
7 car pa parks, with 3,060 parking spaces. Cult ultural centr tre in Valencia / Spor ports centr tre in Móstoles / Wa Wate ter r trea reatment pl plant in Ribadeo /
Spain pain Spain pain
Al Alten El El Casar, 13 MWp photovoltaic plant with tariffs in n the he seco cond auct uction in Jul.17 (25 25 years)
mplementation in n Ju
GO Baraja jas, lon
tay car park at Madrid airport, with 600 parking space aces
mplementation since ce 19
EQUITY INVESTED €35
35MN
EQUITY COMMITTED €50
50MN
+4% revenue growth
AL ALTEN has a 10% stake in a 350 MW MW photovoltaic plant in Mexico and develops 40 MW MW in Namibia.
ALTEN (Mexico and nd Nam Namib ibia ia)
24
4 ROADS KM COUNTRY CLIENT AMOUNT SITUATION 137 Colombia Concession company (own construction) €47Mn To be completed in the 1st half of 2020 Conexión Norte toll road 145 Colombia Concession company (own construction) €50Mn To be completed in the 1st half of 2020 Ruta Caribe toll road 369 Colombia ANI €150Mn (execution term: 5 years). Work starts in June 2019 Transversal del Pacífico road 65 Colombia INVIAS €29.6Mn
ENERGY
4 roads 4 hospitals 4 waterworks and 1 refurbishment
25
4 ROADS KM COUNTRY CLIENT AMOUNT MONITORING OF CONSTRUCTION DEADLINE
Transversal del Sisga toll road 137 Colombia Concession company (own construction) €47Mn To be completed in the 1st half of 2020, meeting the deadlines. Conexión Nortet toll road 145 Colombia Concession company (own construction) €50Mn To be completed in the 1st half of 2020, meeting the deadlines. Ruta Caribe toll road 369 Colombia REIT €150Mn Work starts in 2020. Execution term: 5 years. Transversal del Pacífico toll road 65 Colombia INVIAS €29.6Mn Completed in the 1st half of 2018.
4 HOSPITALS COUNTRY CLIENT AMOUNT MONITORING OF CONSTRUCTION DEADLINE
Tepic General Hospital Mexico Concession company (own construction) €24Mn To be completed in the July 2019, improving the deadline. Andahuaylas General Hospital Peru Apurimac regional government €13.5Mn To be completed in the 1st half of 2020, meeting the deadlines. Pasco General Hospital Peru Pasco regional government €14.17Mn
3rd level hospital in Potosí Bolivia Ministry of Health €17.6Mn To be completed in the 1st half of 2020, meeting the deadlines.
4 WATERWORKS AND 1 REFURBISHMENT COUNTR Y CLIENT AMOUNT MONITORING OF CONSTRUCTION DEADLINE
Magangué water supply Colombia FINDETER €5Mn To be completed in the 1st half of 2019, meeting the deadlines.
Panama Republic of Panama government €53Mn Phase III to be completed in the 1st half of 2019 and Phase 1 in the 1st half of 2020, meeting the deadlines. Santiago Veraguas drinking water plant Panama IDAAN €8.04Mn To be completed in the 1st half of 2020, meeting the deadlines. North Panama aqueduct Panama CONADES €73.5Mn To be completed in the 2nd half of 2020, meeting the deadlines. Refurbishment of Panama Cathedral Panama National Cultural Institute €10.15Mn
26
✓ THE ORTIZ GROUP DEVELOPS COMPREHENSIVE SOLUTIONS FOR EXECUTING COMPLEX PROJECTS. ✓ ENGINEERING, INNOVATION, SAFETY AND ENVIRONMENT SOLUTIONS TO MEET THE CONSTRUCTION DEADLINES, WITH HIGH QUALITY AND SAFETY STANDARDS.
Innovative solution to enhance the reinforced concrete structure of tall buildings subjected to strong wind loads. RDI ENG NGINEERING Integration of safety in the construction design and planning. Waste reduction. Rational use of raw materials.
CONSTRUCTION OF TEPIC HOSPITAL IN MEXICO (150 beds)
PREFAB STRUCTU TURE RE On-site prefab plant. Centralised in Ortiz Spain Structural seismic design optimisation. Prefab engineering. Integration in the medical equipment project including "grey scrubs". Higher standards than the country's requirements. SAFETY
REFURBISHMENT AND STRUCTURAL REINFORCEMENT OF ESPAÑA BUILDING
SAFETY ENVIRONMENT MEDICAL EQUIPMENT ENG NGINEERING
27
CORPORATE DEBT BEFORE RESTRUCTURING CORPORATE DEBT AFTER RESTRUCTURING CHART OF 2014 & 2018 BOND PRICES ACCOMPLISHED GOAL WITH THE RESTRUCTURING Reduce financial costs (175 bp) Ext Extend bo bond ma matu turit ity: y: 20 2023 23. Arrange corporate debt, cancelling €30Mn of international SBLC debt. Reduce financial costs (Goal for 2019: 2%) Extend debt maturity: 2023.
Amount: €120Mn Debt at 30/06/2018: €99.4Mn International SBLC debt: €30Mn Maturity: 2020 Margin: 3.5%)
SYNDICA CATED 2015 015
Amount: €134.25Mn Maturity: 2023
Margin: 2% (based on the ratio)
SYNDICA CATED 2018 018 RE REIT INTE NTERN RNATIONAL SBLC C DEBT:
AM AMOU OUNT MA MATURITY Y RATI RATING COU OUPON €50Mn 2019 2019 BB BB 7.00% Ortiz's position in the bond: €17.9Mn BON OND 2014
SYND YNDICATE TED LO LOAN BONDS
BON OND 2014 €23.8Mn 2019 BON OND 2018 AM AMOU OUNT MA MATURITY Y RATI RATING COU OUPON €50Mn 2023 2023 BB BB+ + 5.25% Ortiz's position in the bond: €22.9Mn BB B 7.00%
97,000 98,000 99,000 100,000 101,000 102,000 103,000 104,000
2-1-18 2-2-18 2-3-18 2-4-18 2-5-18 2-6-18 2-7-18 2-8-18 2-9-18 2-10-18 2-11-18 2-12-18 2-1-19 2-2-19
2014 Bond prices since 2/01/2018
102.146
28
90,000 95,000 100,000 105,000 110,000 115,000
11-7-18 11-8-18 11-9-18 11-10-18 11-11-18 11-12-18 11-1-19 11-2-19
2018 Bond prices since 11/02/2018
112.070
Fi Figures s in mill illion
s of euros
29
30
2018 december audited data. Figures in millions of euros.
MAINTAINING THE DEBT REDUCTION STRATEGY
FINANCIAL NEEDS RELATED TO PROJECTS
Projects EPC Energy.
OR ORTIZ IZ GRO ROUP DEBT BT
ORPORATE TE DEBT BT 2017 2018 % CHANGE AVAILABLE E2019 Syndic dicate ted d Tranc nche he A 45,07 66,40 60,01 Syndic dicate ted d Tranc nche he B 0,00 0,00 67,12 0,00 MA MARF RF bonds 33,28 51,48 26,43 Curre rrent nt assets ts 41,69 0,00 25,95 0,00 TOT OTAL COR ORPORATE TE DEBT BT 120,04 117,88
2% 86,44
BT FRO ROM M PRO ROJE JECTS CTS Constr tructi tion 3,17 3,01 2,27 Concessions ns 12,35 10,79 5,63 Re Renta tal 13,77 13,59 TOT OTAL DEBT BT FRO ROM PRO ROJECTS TS 29,29 27,39
6% 7,9 III.
BT: OT OTHE HER FINA NANCIA IAL LIABI BILITI ITIES CDTI TI 5,61 5,92 6 FACTO TORIN ING PEND NDIN ING RE REFUN UND 29,95 25,14 25 25 TOT OTAL DEBT: BT: OT OTHE HER R FINA NANCIA IAL LIABI BILITI ITIES 35,56 31,06
14% 31 31 RE REDUCTION TION IN N DEBT BT WI WITHOU OUT T RE RECOURSE RSE
11
11 TOT OTAL DEBT BT WI WITH TH RE RECOUR URSE 173,89 165,33
5% 125,34 ASSET POS OSITI ITION ONS 69,79 89,65 70,00 TOT OTAL NE NET DEBT BT 104,10 75,68
27% 55,34
Project debt redemption €16.78Mn:
Redemption of the syndicated tranche A: €6.33Mn. Redemption of MARF bonds maturing in 2019: €23.8Mn.
31
254 220
TOT OTAL do domestic and inte nternati tional de debt t re related to
nd re renta tal pr proje
ts 96% with thout rec recourse
2017 2018 244 164
De Debt fro rom dom domesti tic pr proje
ts for
con
nd re renta tals 92% with thout rec recourse
Deuda no consolidada 2017 Deuda no consolidada 2018
Debt fro rom inte ternat ational pro roje jects ts for
con
100% with thout t re reco course
Deuda no consolidada 2017 Deuda no consolidada 2018
56.3
+ €46.6Mn
9.7
Fi Figures s in mill illion
s of euros
32
33
Figures in millions of euros
2.26 NFD/EBITDA RATIO (DEBT ONLY WITH RECOURSE)
Figures in millions of euros
1.60 NFD/EBITDA RATIO (DEBT ONLY WITH RECOURSE)
2018
CONSOLIDATED GRUPO ORTIZ :
2017
CONSOLIDATED GRUPO ORTIZ : 2.61 NFD + INDIRECT DEBT/INDIRECT EBITDA RATIO 1.89 6.06 EBITDA/NET FINANCIAL EXPENSE RATIO 5.64 NFD + INDIRECT DEBT/INDIRECT EBITDA RATIO EBITDA/NET FINANCIAL EXPENSE RATIO
* Including additional EBITDA to the consolidated amount of €8.08Mn
3.00 3.90 2.50
46,12 104,1 Grupo Ortiz EBITDA NFD with recourse
Fi Figures s in mill illion
s of
Audited data.
47,74 76,17 Grupo Ortiz EBITDA NFD with recourse
34
35
►Benchmark player on a national level with a track record advancement in the
consolidation of the international business.
With 58 years of history, Ortiz is positioned as a benchmark company in the national infrastructure market. Since 2010, its internationalisation strategy has focused mainly on Latin America, where it is currently consolidated in Mexico, Colombia, Peru and Panama. International activity consolidated itself in 2018 as the main source of turnover (66%), with significant growth in the 'Energy' segment and the concessions area as key strategic elements in the external development of recent years.
►Business with positive fundamentals in terms of diversification by business areas
and by market, allowing at this time the growth of the turnover and contracting.
'Multi‐segment' operations within the construction activity is widely developed in the Ortiz group, currently allowing the company to reach historical figures in terms of results and the obtaining of a positive recurrence in the winning of contracting. In 2018 the outstanding portfolio (including 12 months of concessions) increased by 18% to 1,224M, maintaining a coverage ratio over revenues above 2x.
► Adequate returns on operations, currently encouraged by disinvestment in
assets and reduction of the financial indebtedness.
In 2018, Ortiz continued with the generation of positive results, achieving record turnover (€605M) and continuing the divestment of assets, mitigating the lower profitability. Lower profitability in operations and negative exchange rate differences (accounting effect) made it difficult to obtain higher results at the end of last year. The progress with regard to reducing net financial debt made it possible to meet the targets by obtaining a Net Financial Debt/EBITDA ratio (calculated for a covenant) of 1.6x.
► Adequate liquidity situation, within a negative trend in the cash flow from
(Syndicated Loan + Bond) confirm the improvement of the financial flexibility and allow to support the solvency.
The financial improvement of 2018 is based on the increase in the cash position, an aspect supported mainly by progress made in the divestment of assets. The net cash generated by investments has offset the lower profitability and negative cash generation in working capital. On the other hand, the renewal of its main sources of financing allowed it to sustain the increase in liquidity, making progress in the reduction of the financial debt, although more is still pending in 2019 with the amortisation of part of the bond.
Outlook: Positive
First rating date:26/05/2014 Review date: 25/04/2019
Ortiz is currently in a favourable financial situation, after meeting its debt targets and renewing its financial liabilities, while adequately winning new contracts. The consolidation of the positive results and the reduction of debt, under a scenario of higher profitability and cash generation in operations, and the progress made in the winning of new contracts, are elements for a potential increase in the rating. On the other hand, a reduction in profitability and in the capacity to sustain its new contracts are elements for a potential downgrade in the rating.
Fi Figures s in mill illion
s of
Audited data.
The Ortiz Group's commitment to sustainability is reflected in its contribution to meeting the goals defined by United Nations
We contribute to water availability, supply and treatment. Energy through renewable sources in developing countries. 60 MW in generation 1,250 MW under construction Investment in RDI for greater efficiency in Infrastructure. Goal: be a carbon neutral company and continue to contribute to the fight against climate change Our own Equality Plan, with 28% of women in
Talent management, Training Work-Life Balance Social benefits Sustainable production and use of new consumption methods Our Good Governance, Code of Ethics and Compliance Programme guide the company's actions. Committed to solidarity projects at domestic and international level focusing on education, health, inclusion and development.
OUR MAIN COLLABORATIONS
social exclusion by helping them to integrate.
in Senegal.
sustainable development and social inclusion.
material.
disabilities.
OUR COMMITMENTS
EMPLOYEES
increasing the safety of our workforce and achieving ZERO accidents.
ENVIRONMENT & INNOVATION
resources
revenues.
GOOD GOVERNANCE
2010
with internal audit
The ORTIZ GROUP contributes to the economic and social development of the action areas where it executes its projects by generating employment, clean energy, infrastructure and social wealth, thus improving the quality of life of the communities where it is present. A total of 66% of the Group's revenues correspond to international projects, nearly all of which are social projects.
39
40
Revenue expected in the business plan met
(Projected: €592Mn).
REIT
Sale of REIT
GROUP GROWTH IN 2018
Asset rotation
concession (Colombia).
II).
DEBT REDUCTION
Reduction in NFD
Reduction in debt with recourse
RATIOS MET
Syndicated and bond ratios
3.90
ASSET ROTATION
Restructuring of syndicated debt + new bond issuance
DEBT RESTRUCTURING