
SLIDE 1
From calls to counts: Estimating animal density using passive acoustic monitoring (PAM)
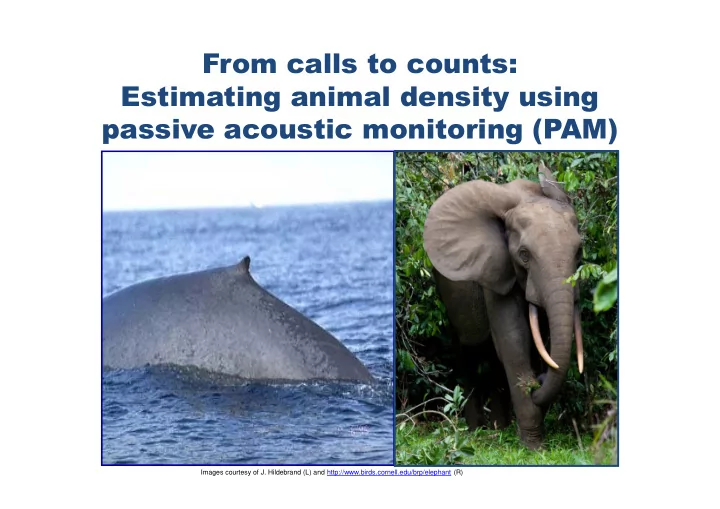
Images courtesy of J. Hildebrand (L) and http://www.birds.cornell.edu/brp/elephant (R)
From calls to counts: Estimating animal density using passive - - PowerPoint PPT Presentation
From calls to counts: Estimating animal density using passive acoustic monitoring (PAM) Images courtesy of J. Hildebrand (L) and http://www.birds.cornell.edu/brp/elephant (R) Why acoustics? A wealth of recorded information Acoustic
Images courtesy of J. Hildebrand (L) and http://www.birds.cornell.edu/brp/elephant (R)
20 40 60 80 100 10 20 30 40 50
Image courtesy of FreeDigitalPhotos.net
20 40 60 80 100 10 20 30 40 50
Image courtesy of FreeDigitalPhotos.net
T = monitoring time = cue rate
A simplified example: 125 detections in a 1 hour survey (t = 1). = 0.2. (probability of detecting a whale call) = 0.4. = 5 calls per hour.
ࢉࢇ࢙ ࢇࢇ࢙ ࢉࢇ࢙
Distance sampling/spatial capture recapture Auxiliary data/more assumptions
Image taken from: Van Ngoc Thinh et al (2010) Image taken from: Measey et al (2016) Image courtesy
Phil_Bird at FreeDigital Photos.net
http://nearest.bo.ismar.cnr.it/
Courtesy of http://www.afsc.noaa.gov
From: http://nearest.bo.ismar.cnr.it/
NB: Preliminary results
http://cetus.ucsd.edu/voicesinthesea_org/species/pinnipeds/weddellSeal.html