
SLIDE 1
1
1
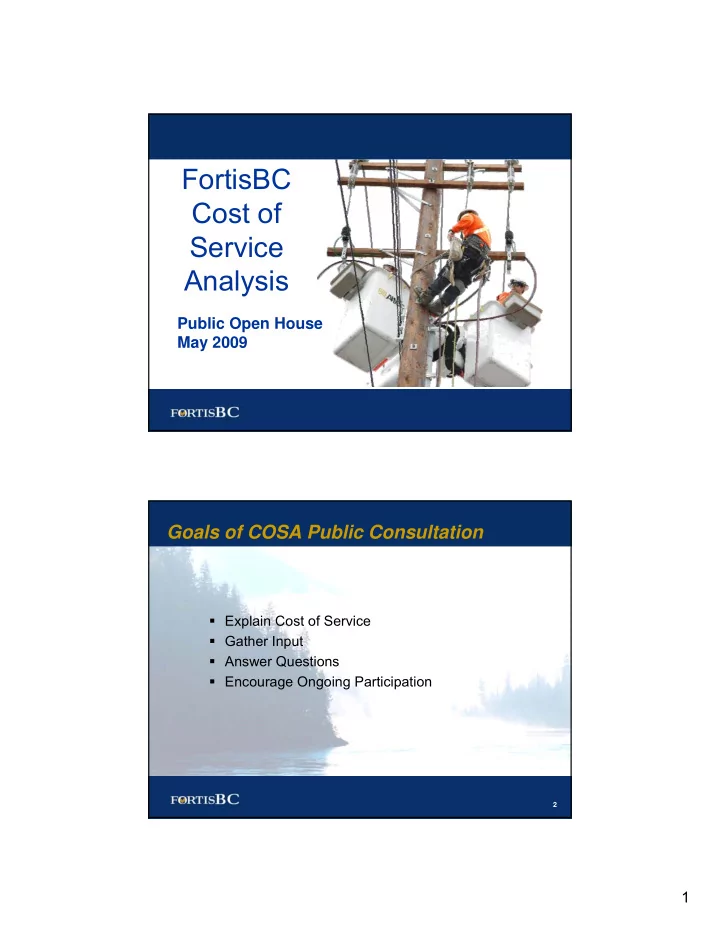
FortisBC Cost of Service Analysis
Public Open House May 2009
2
FortisBC Cost of Service Analysis Public Open House May 2009 1 - - PDF document
FortisBC Cost of Service Analysis Public Open House May 2009 1 Goals of COSA Public Consultation Explain Cost of Service Gather Input Answer Questions Encourage Ongoing Participation 2 1 The Public Consultation Process
1
2
3
4
5
6
7
Power Supply Operations & Maintenance Depreciation & Taxes Interest and Return
the utility
Commission
Revenue Requirement =
8
Revenue Requirement to the Customer Classes.
Customer Class. Why now?
9
Revenue Requirement
Revenue Requirement – The “Size” of the Pie
Residential Irrigation Lighting Commercial Wholesale Industrial
10
Revenue Requirement Cost of Service Analysis Rate Design
is causing and how much revenue the utility is collecting from each.
11
Determine the revenue requirement of the utility Revenue Requirement Determination Step 1 Functionalize costs and services Step 2 Classify costs Step 3 Allocate costs among customer classes Cost of Service Analysis Design rates Rate Design 12
Total Cost
(Revenue Requirement)
Transmission Production Distribution Customer
13
Total Cost
(Revenue Requirement)
Transmission Production Distribution Customer
Fixed
(Demand)
Customer Variable
(Energy)
Direct 14
classified costs to different groups of customers
Meter costs can be allocated based upon the number of customers in each class of service
Class of Service Number of Customers % Residential 4,000 93.9% Commercial 250 5.9 Industrial 10 0.2% Total 4,260 100.0%
15
Total Cost
(Revenue Requirement)
Transmission Production Distribution Customer
Demand
(Fixed)
Customer Energy
(Variable)
Direct
Residential Industrial Commercial Wholesale 16
Since 1997 the FortisBC system has changed in a number of ways:
17
18
paying relative to their allocated costs.
82.3% Nelson Wholesale 104.9% BCH Yahk Wholesale 103.3% BCH Lardeau Wholesale 85.4% Grand Forks Wholesale 96.4% Summerland Wholesale 80.4% Penticton Wholesale 90.1% Kelowna Wholesale 81.3% Irrigation 84.8% Lighting 54.4% Industrial Transmission 125.9% Industrial Primary (30) 143.1% General Service (21) 111.9% Small GS (20) 97.1% Residential 2009 Revenue To Cost Ratio
19
20
Determines,
each class.
21
Service Analysis is complete. Some considerations:
unreasonable, unduly discriminatory or unduly preferential rate for a service provided by it in British Columbia,…. UCA Section 59
efficiency and conservation. (2007 Energy Plan – Policy Action 4)
22
23
24
25
26