
SLIDE 1
FORTH Overview Financial Performance FORTH Direction FORTH - - PowerPoint PPT Presentation
Agenda FORTH Overview Financial Performance FORTH Direction FORTH CORPORATION PUBLIC CO., LTD. Forth Corporation Public Company Limited (FORTH) was established in 1989 under the name of "Genius Communication System Company
FORTH Overview Financial Performance FORTH Direction Agenda
Forth Corporation Public Company Limited (FORTH) was established in 1989 under the name of "Genius Communication System Company Limited" which has registered capital amounting to Baht 1 million. The company purposed to research, develop and manufacture Private Branch Exchange (PBX) under the trademark of FORTH, Printed Circuit Board Assembly (PCBA) and electronic equipments manufacturing. Then, the company made capital rising and be listed in the Stock Exchange of Thailand in 2005. Nowadays, the company has registered capital amounting to Baht 480 million and 4 business units which are Electronics Manufacturing Service business, telecommunication business, technology related business and Retail business (Top-up Kiosks).
FORTH CORPORATION PUBLIC CO., LTD.
1) 12 SMT lines 2) 2 Manual Factory Insertion lines 3) Final Assembly line
Nakhon phathom Province
6,000 Million points/year
Production Lines
FORTH Factory
Research & Development Center
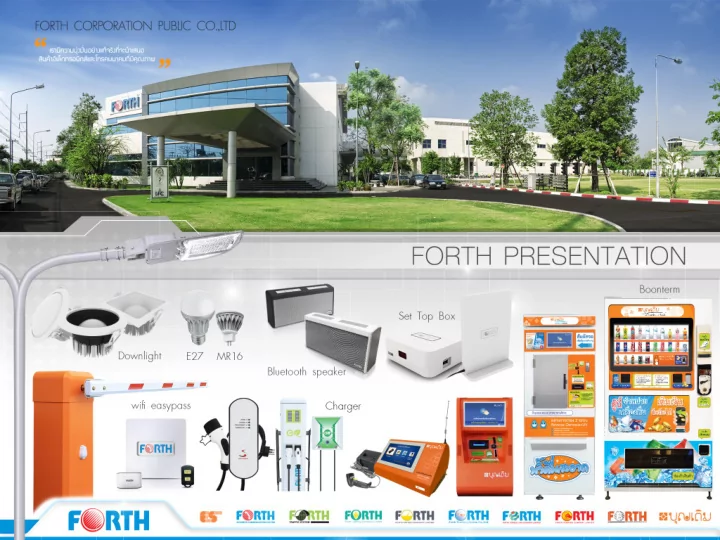
FORTH’s Products
FORTH’s Business units
Forth’s business has divided into 4 business units
1 2 4 3
Electronics Manufacturing Service (EMS)
1.1 Electronics components distributor (Trading) 1.2 Turnkey and consign (Factory)
Telecom business
2.1 Telecom solution 2.2 Telecom products
Technology related business
3.1 Traffic system (Traffic light, CCTV) 3.2 Enterprise Resource Planning (ERP) 3.3 LED lighting
Retail business
4.1 Domestic Top-up kiosk (Boonterm) 4.2 Oversea Top-up kiosk 3.4 Electric meter 3.5 Tracking system (GPS)
Technology related
Business highlight
14
As of DEC 2017
124,653 70
4
(Jan-Dec 2017)
2,192,335 36,174 25
Monthly Top-up Amount
Month Top-up amount Days
Jan-17 86,947,300.58 31 Feb-17 89,275,875.79 28 Mar-17 92,447,372.35 31 Oct-17 108,014,359.55 31 Nov-17 110,795,562.93 30 Dec-17 112,245,091.58 31 Jan-18 114,373,629.42 31 Feb-18 117,265,117.29 28 Mar-18 123,228,846.43 7
Customer reference
FORTH Overview Financial Performance FORTH Direction Agenda
Financial Highlight
Unit: MB
Total Revenue from 4 core business
5,021 5,262 6,950
Total revenue (core business)
2015 2016 2017
+5% +32%
Financial Highlight
Gross Profit and Net Profit
Unit: MB
1,519 460 1,466 366 1,647 272
Gross Profit Net Profit
2015 2016 2017
+12%
Financial Highlight
Gross Profit Margin and Net Profit Margin
28% 8% 28% 7% 24% 4%
Gross Profit Margin Net Profit Margin
2015 2016 2017
Revenue Proportion by Business Unit
Financial Highlight
EMS 32% Telecom 5%
19% Retail 44%
2016
EMS 26% Telecom 14%
28% Retail 32%
2015
EMS 30% Telecom 21% Tech. Related 23% Retail 26%
2014
EMS 33% Telecom 7% Tech. Related 13% Retail 47%
2017
1,318 727 1,388 1,588 1,657 264 1,022 2,319 2,300 483 913 3,254
2015 2016 2017
Financial Highlight
Revenue by Business Unit
Unit: MB
21% 29% 37% 32% 21% 38% 29% 31% 19% 28% 16% 28%
2015 2016 2017
Financial Highlight
Gross profit margin by Business Unit
525 793 690 967 1,347 953
Factory Electronic Source
2015 2016 2017
Financial Highlight
1,318 1,657 2,300
Unit: MB
Financial Highlight
Unit: MB
727 264 483
727 264 483
Projects
2015 2016 2017
976 358 54 785 117 120 800 70 43 GTS&JV ERP Others 2015 2016 2017
Financial Highlight
1,388 1,022 913
Revenue Unit: MB
Financial Highlight
1,547 2,245 3,105
15,386 23,383 36,174
Top-up Value (MN. Baht)
2015 2016 2017 65,867 92,082 124,653
Unit: MB
Total Assets & Capital structure
Financial Highlight
2,163 2,937 3,658 3,811 3,932 4,491
2015 2016 2017
Total Cur. Assets Total Non-Cur. Assets Total assets 5,974 MB Total assets 8,149 MB Total assets 6,869 MB
Unit: MB
2,506 2,629 2,720 283 567 619 3,185 3,673 4,810
2015 2016 2017
Total Cur. Liabilities Total Non-Cur. Liabilities Total Equity D/E 1.4 times D/E 1.6 times D/E 2.0 times
Financial Highlight
Earnings Per Share (EPS) and Dividend Per Share (DPS)
Baht per share *Separate financial statements
0.59 0.48 0.41 0.32 0.34 0.42
2015 2016 2017
EPS* DPS
Financial Highlight
Dividend yield
NOTE: Dividend yield = Dividend Per Share / Average price
4.6% 4.5% 6.0%
2015 2016 2017
2015 2016 2017
FORTH Overview Financial Performance FORTH Direction Agenda
Backlog : Projects 2018 Vending Machine/Box24/EV Charger + BeWallet Electronic Monitoring FORTH’s Direction
ล ำดับ โครงกำร หน่วยงำน มูลค่ำงำน (ล้ำนบำท) รวมภำษีมูลค่ำเพิ่ม 1 เช่าและติดตั้งอุปกรณ์เครื่องมืออิเล็กทรอนิกส์ พร้อมระบบที่เกี่ยวข้องส าหรับ ตรวจสอบ หรือจ ากัดการเดินทางของบุคคลในการปล่อยตัวชั่วคราว ส านักงานศาลยุติธรรม
80.88
2 ซื้อขายพร้อมติดตั้งอุปกรณ์โครงข่าย IP Access Network (MPLS Router) ในพื้นที่การไฟฟ้าส่วนภูมิภาคเขต 1, 2, 3 (ภาคเหนือ) การไฟฟ้าส่วนภูมิภาค
342.83
3 ซื้อขายพร้อมติดตั้งอุปกรณ์โครงข่าย IP Access Network (MPLS Router) ในพื้นที่การไฟฟ้าส่วนภูมิภาคเขต 1, 2, 3 (ภาคใต้) การไฟฟ้าส่วนภูมิภาค
312.23
4 จ้างเหมาตรวจซ่อมและบ ารุงรักษาอุปกรณ์โครงข่ายระบบสื่อสาร DWDM และ IP-Core Network แบบเตรียมความพร้อม ตลอด 24 ชั่วโมง รวม 12 เขต การไฟฟ้าส่วนภูมิภาค
256.99
5 ซื้อขายกล้องบันทึกภาพเคลื่อนไหวบนสถานีต ารวจ จ านวน 1,482 ชุด (กิจการร่วมค้า ฟอร์ท จีเนียส และจีเนียสทราฟฟิค) ส านักงานส่งก าลังบ ารุง ส านักงานต ารวจแห่งชาติ
460.01
6 ซื้อขายพร้อมติดตั้ง ปรับปรุงอุปกรณ์โครงข่าย DWDM (Dense Wavelength Division Multiplexing) และ IP Core Network การไฟฟ้าส่วนภูมิภาค
93.73
7 จ้างเหมาตรวจซ่อมและบ ารุงรักษาโครงข่ายสายเคเบิลใยแก้วน าแสง การไฟฟ้าส่วนภูมิภาค
59.19
*8 ซื้อขายรถยนต์ไฟฟ้าตรวจการณ์อัจฉริยะ (Smart Potrol Car) จ านวน 260 คัน (จีเนียส ทราฟิค) ส านักงานต ารวจแห่งชาติ
898.81
รวม
2,504.67
Backlog : Projects 2018 รับรู้รำยได้ในปี 2018
หมายเหตุ : *อยู่ระหว่างรอลงนามสัญญา
ล ำดับ หน่วยงำน จ ำนวนโครงกำร มูลค่ำงำนโครงกำร (ล้ำนบำท) 1 TOT
6 2,776
2 กสทช.
1 2,000
3 MEA
7 1,731
4 PEA
7 3,854
5 หน่วยงานยุติธรรม
2 230
6 สตช.
2 3,000
7 กทม.และอบต. ท้องถิ่นต่างๆ
7 965
หมำยเหตุ : คำดกำรณ์ว่ำ จะประมูลได้ ร้อยละ 30 - 40 จำกมูลค่ำโครงกำรทั้งหมด
งำนโครงกำรโทรคมนำคมที่บริษัทฯ จะเข้ำร่วมประมูล ในปี 2018 - 2019
Backlog : Projects 2018 Vending Machine/Box24/EV Charger + BeWallet Electronic Monitoring FORTH’s Direction
Vending machine/Box24/EV Charger
Vending machine
Vending machine
Vending Products 2018
Vending Product 2018
439 476 518 546 568 636 663 712 817 926 1,056 1,195 1,321 1,409 1,451 1,482 1,502 1,564
1,000 1,500 2,000 Number of Kiosks
Vending performance
จ ำนวนตู้เวนดิ้ง
Box24
EV Charger
EV Charger
EV Charger
EV Charger : Motor Show 2017
Vending machine/Box24/EV Charger + BeWallet
Vending machine/Box24/EV Charger + BeWallet
Vending machine/Box24/EV Charger + BeWallet
Backlog : Projects 2018 Vending Machine/Box24/EV Charger + BeWallet Electronic Monitoring FORTH’s Direction
Electronic Monitoring
Electronic Monitoring
Electronic Monitoring
Statements included or incorporated in these materials that use the words "believe", "anticipate", "estimate", "target", or "hope", or that otherwise relate to objectives, strategies, plans, intentions, beliefs or expectations or that have been constructed as statements as to future performance or events, are "forward-looking statements" within the meaning are not guarantees of future performance and involve risks and uncertainties that could cause actual results to differ materially from historical results or those anticipated at the time the forward-looking statements are made. FORTH undertakes no obligation to publicly update or revise any forward-looking statement, whether as a result of new information, future events or otherwise. FORTH makes no representation whatsoever about the opinion or statements of any analyst or
use of any such opinion or statement.
FORTH Investor Relations
www.forth.co.th investor@forth.co.th
Disclaimers