
SLIDE 1
for 52 weeks ended 2 April 2016 17 May 2016 Q4 AND FULL YEAR SALES - - PowerPoint PPT Presentation
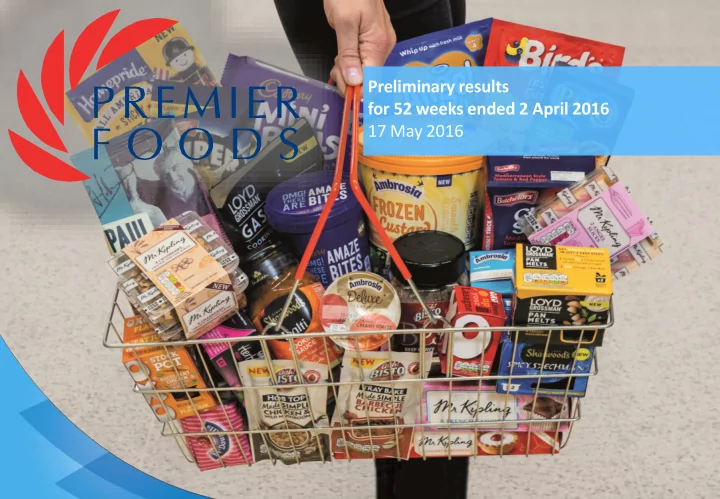
Preliminary results for 52 weeks ended 2 April 2016 17 May 2016 Q4 AND FULL YEAR SALES GROWTH Results provide strong platform for future growth prospects 131m +4.6% 51m +0.6% +1.4% Full Year Quarter 4 Full Year Adjusted Net debt
Full Year sales growth Quarter 4 sales growth
Full Year Trading profit
Adjusted eps growth
Net debt reduction
FY14/15 Q1-Q4 trends re-stated to reflect commercial costs re-alignment
Q1 Q2 Q3 Q4 Q5
FY14/15 FY15/16
Q1 Q2 Q3 Q4
(6.6%) (6.8%) (4.9%) (5.5%) (0.6%) (1.6%) +2.4% +0.1% +1.4%
Growth strategy delivering results New strategic initiatives
6 of top 8 brands
New investment partner
Group sales
FY16/17 & Medium-term sales guidance Strong future prospects
Alastair Murray Chief Financial Officer
year one-off items and wider employee recognition costs
£m FY15/16 FY14/15 Change (%) Q4 Change (%)
Branded sales 684 684 (0.0%) +1.0% Non-branded sales 88 83 +5.5% +6.5% Total sales 772 767 +0.6% +1.4% Divisional contribution 167 163 +2.4% Group & corporate costs (36) (32) (12.1%) Trading profit 131 131 +0.0% Trading profit % 17.0% 17.1% (0.1ppt) Trading profit ex Consumer marketing 167 164 +1.8%
£m FY15/16 FY14/15 Change (%) Q4 Change (%)
Branded sales 505 509 (0.7%) +0.2% Non-branded sales 44 43 1.1% +3.8% Total sales 549 552 (0.6%) +0.5% Divisional contribution 142 145 (2.1%) Divisional contribution % 25.9% 26.3% (0.4ppt)
channels
comfortably into double-digit margins
£m FY15/16 FY14/15 Change (%) Q4 Change (%)
Branded sales 178 175 +1.9% +3.0% Non-branded sales 45 41 +10.0% +10.5% Total sales 223 216 +3.4% +3.8% Divisional contribution 25 18 38.9% Divisional contribution % 11.2% 8.3% +2.9ppt
£m FY15/16 FY14/15
Underlying business Trading profit 131 131 Less: previous disposals (2) (2) Continuing operations Trading profit 129 129 Amortisation of intangible assets (38) (37) Foreign exchange fair value movements 3 (1) Restructuring costs (11) (10) Net interest on pension and administration costs (15) (38) Loss on disposal of businesses
Impairment (13) (84) Operating profit/(loss) 55 (47) Operating profit before impairment and loss on disposal of business 68 43
£m Hovis Knighton Total Carrying value at 4 April 2015 22 13 35 Interest receivable 1 1 Share of loss from associates (14) (9) (23) Impairment charge (9) (4) (13) Carrying value at 2 April 2016
£m FY15/16 FY14/15 Change (%)
Trading profit1 131 131 0.0% Net regular interest (45) (48) 6.0% Adjusted PBT 86 83 3.5% Notional tax @ 20.0%/ 21.0% (17) (17) 1.5% Adjusted earnings 69 66 4.8% Weighted average shares in issue (million) 826.0 824.4
8.3p 8.0p 4.6%
1 – Underlying Trading profit, excludes impact of joint ventures entered into
585 13 25 42 8 526 8 534 131 16
400 420 440 460 480 500 520 540 560 580 600
Net debt FY14/15 Trading profit Depreciation Pensions Capex Interest Working capital / Other Restructuring Net debt Pre-Knighton Knighton Net debt FY15/16
£m
4.0x 3.6x
RHM surplus offsets Premier Foods scheme deficit; Discount rate up +25bps
IAS19 Accounting valuation (£m) 2 April 2016 4 April 2015
RHM Premier Foods Combined RHM Premier Foods Combined
Assets 3,759 584 4,343 3,636 613 4,248 Liabilities (3,208) (1,004) (4,212) (3,394) (1,066) (4,460) Surplus/(Deficit) 551 (420) 131 242 (453) (212) Surplus/(Deficit) net of notional tax (Tax @ 20.0%/21.0%) 441 (336) 105 191 (358) (167) Discount rate 3.55% 3.55% 3.55% 3.30% 3.30% 3.30% Inflation rate (RPI) 3.00% 3.00% 3.00% 3.00% 3.00% 3.00%
surplus for over 12 months
relatively constant at c.£400m
treatment may prescribe non- recognition of accounting surpluses and potential change in valuation methodology
£m 551 (420)
(600) (400) (200) 200 400 600 800
Dec 2013 Apr 2016
RHM Premier Foods
FY16/17 guidance £m
Working capital Neutral to positive Depreciation £17-18m Capital expenditure £20-25m Interest – cash £40-£43m Interest – P&L c.£44-45m Tax – cash Nil Tax – notional P&L rate 20.0% Pension deficit contributions £48m Pension administrative & PPF levy cash costs £8-£10m Restructuring costs £10-£12m Consumer marketing £42-£44m
Gavin Darby Chief Executive Officer Operating Review
0.0 3.0 Jul 2014 Mar 2016 (3.0) 0.0 3.0 Jul 2014 Mar 2016
Source: Kantar Worldpanel , Total Grocery 12 w/e 27 March 2016
% +2.7% Volume Inflation/(Deflation) (1.5%) %
Existing growth momentum Strategic initiatives Sales guidance +2-4%
Growth channels Innovation Marketing Revenue mgmt Cake on the Go International Grocery chilled
Opportunity
FY15 Q1-Q4 trends re-stated to reflect commercial costs re-alignment
Q1 Q2 Q3 Q4 Q5
FY14/15 FY15/16
Q1 Q2 Q3 Q4
(6.6%) (6.8%) (4.9%) (5.5%) (0.6%) (1.6%) +2.4% +0.1% +1.4%
Source: Kantar Worldpanel, 52 w/e 27 March 2016 2 years average growth
Category Volume Sales Share
+0.1ppt +1.1ppt
+1.1ppt +0.5ppt
Flavourings & Seasonings Cake Total Categories
(0.7ppt)
Top 6 performing brands Ambrosia + Batchelors 3.4% 5.9% 8.5%
Sales growth % Marketing % Sales NPD % Sales
(2.9%) 1.8% 3.3%
Sales growth % Marketing % Sales NPD % Sales c.60% of branded sales c.25% of branded sales
2014 2015/16
Marketing Investment & Innovation (15 months)
Sales decline Investment Product Launches Sales growth
All data is Company sourced FY15/16 and FY14
Sales from innovation
Consumer marketing (£m)
Source: IRI, New & Existing product development, 52 w/e 19 March 2016
6.9% 11.3% 18.1% 20.0% FY14 FY15 FY16 Target
25 33 36 42-44
2013/14 2014/15 2015/16 2016/17F
Consumer Trends
Convenience Foodieness Indulgence
Consumer Trends
Premium
Ambrosia Deluxe Custard and Frozen Custard Batchelors Protein & Veg Pots and Soup ranges
Healthier
1 – Kantar Worldpanel, 52 w/e 16 August 2015
NOW LISTED IN MOST MAJOR RETAILERS
Premium product sales % total Group sales Premium NPD launches as % total launches Typical % premium per serving Premiumisation Promotional Efficiency
Display
driving volumes
volumes over Christmas
ROI
investment in critical Q3 trading period
Online1 Hard Discounters1,2
Market Premier Foods Market Premier Foods
maximum impact for user
functionality
Treats
delivered especially strong volumes
Source: 1 - Kantar Worldpanel, 52 w/e 27 March 2016; 2 – Hard discounters for Premier Foods is FY15/16 Turnover
Australasia
USA
Mr Kipling cake trial in USA in Q3
Mud Pies in 250 stores
FY Sales growth Indian sauces market share
People
since 2014
strategic growth geographies ‒ USA, Australia, Middle East
1 – Constant currency, including Ireland
FY Sales growth Indian sauces market share
Line Efficiency
Streamlined Teams
reduction across Grocery manufacturing sites
management
flexibility across plant lines Logistics Restructuring
consolidate distribution centres
warehousing and distribution
costs & benefits FY17/18
and product consistency
increased efficiency
Market context
Comprehensive 3-year plan covering broad portfolio
single portion packs as % of portfolio
ingredients
tighten marketing restrictions
Gavin Darby Chief Executive Officer Accelerating Growth
Leverage our brands and retailer relationships to drive growth outside ambient, into chilled groceries Accelerate International roll
demonstrating the potential to deliver important growth for the future Build on the successful performance of Sweet Treats
investing further in our Cake
Sweet Treats
1
International Grocery
2 3
“On the Go” food in significant growth Cake category is underdeveloped Under trade in convenience channels where Sweet Treats “On the Go” purchase takes place
Premier % Share of Branded Cake by Channel Food on the Go market is now worth £19.3bn and is growing at 1.6% YoY1
Sweet Treats Categories % Sales from On the Go Products
1. Kantar Worldpanel Out of Home Snacking 52 w/e 27th March 2016 Source : IRI 52 weeks ending 20th February 2016
Sweet Treats
35.0% 11.0% 5.0%
Confectionery Biscuits Cake
58.0% 16.0%
Top 6 Grocers Convenience
PHASE TWO – NATIONAL ROLL-OUT PHASE ONE - TRIAL
competitor (McVities flapjacks)1
& Kit Kat (Costcutter Manchester)1
4.0 4.5 6.0 4.0 7.3 10.8
Launch Range
2. New team recruited
3. Marketing – Outdoor advertising & TV sponsorship Encouraging Trial Rate of Sale Results Instore Activation
1 – Store level EPOS – Reach inform analytics, IRI data
Sweet Treats
Chilled potentially doubles our market opportunity
£3.7bn £9.2bn £5.5bn Groceries market where Premier currently operates Chilled areas where Premier could credibly play Total potential market
Strategy to seize Leverage strong brand equity
If we were to achieve even a small share of
could result in significant retail sales value
Continue to innovate through new formats and products in various segments Potential examples:
1 2
2 1
Grocery
DEEP CONSUMER INSIGHT CHILLED OPPORTUNITIES IDENTIFIED AMBROSIA BRAND PRODUCT ROLL-OUT
Frozen Custard Ice Cream
Chilled Desserts Breakfast Full Research and U&A study Need State Modelling Time of day Motivation Simple Goodness Good start to the day End of day reward
Household penetration
Prompted awareness
Brand heritage
Grocery
£7.6bn £3.1bn
Fresh Prepared cakes & pies Ambient cakes and pies Very long shelf life
US market opportunity Leverage existing relationship in the US Rely on existing manufacturing capability in the UK (unique snack pack format) Use unique product and format packaging
Build on experience from 250 stores trial
+4.0%
YoY
+5.7%
YoY
Use Premier’s differentiated offering with unique formats and packaging to access white space
Strategy to seize
Source: Mintel June 2014
International
category growth YOY
Seek to extend existing Cadbury licence agreement Leverage Cadbury brand equity in market Use existing manufacturing capability in UK Link with preferred distribution partner
Strategy to seize Middle East market opportunity
£120m £76m
Total Cake KSA & UAE Of Which Modern Trade +1% International
Gavin Darby Chief Executive Officer Nissin opportunities
NISSIN BRANDED PRODUCTS IN UK PREMIER BRANDED PRODUCTS USING NISSIN IP INTERNATIONAL GROWTH
Example markets
SUPPLY CHAIN OPPORTUNITIES
countries to distribute PF brands and products
efficiency and quality
Factories 3 7 2 Employees c.1,200 c.3,000 c.1,700 Sales (USD) 310m 300m 192m Population 318.9m 1,364.3m 206.1m Sources: World bank, USA sales include Mexico & Columbia
41
SEGMENT PATENT POTENTIAL APPLICATION Noodles Laminated multi-layered noodles, allowing another flavour/texture of noodles to be sandwiched between standard noodles Batchelors Super Noodles extension Instant microwaveable noodles that do not require draining Batchelors Deli Box refresh Laser perforation technology that makes thicker noodles hydrate quickly Batchelors Super Noodles XL launch Non Noodles Rice that reconstitutes instantly in hot water Batchelors Deli Box extension Low-fat powdered soup with mouth-feel of conventional soup Batchelors CupaSoup Upgrade A method of freeze-drying meat so that it reconstitutes to near fresh taste and texture in hot water Batchelors Deli Box refresh/ PastaNSauce Refresh
1. Nissin branded products in UK 2. Premier branded products using Nissin intellectual property 3. International expansion 4. Supply chain opportunities
guidance of 2-4%
Certain statements in this presentation are forward looking statements. By their nature, forward looking statements involve a number of risks, uncertainties or assumptions that could cause actual results or events to differ materially from those expressed or implied by those statements. Forward looking statements regarding past trends or activities should not be taken as representation that such trends or activities will continue in the
Please note that any disclosures or statements referring to pro forma results provided in this presentation have not been subject to audit or review by the Company’s auditors.
4 April 2015.
and is defined as Operating profit before amortisation of intangible assets, impairment, fair value movements on foreign exchange and other derivative contracts, restructuring costs, profits and losses associated with divestment activity and net interest on pensions and administration costs.
regular interest is defined as net finance cost after excluding write-off of financing costs, fair value movements on interest rate financial instruments and other interest. Adjusted earnings per share is defined as Adjusted profit before tax less a notional tax charge of 20.0% (2014/15: 21.0%) divided by the weighted average of the number of shares of 826.0 million (52 weeks ended 4 April 2015: 824.4 million). The weighted average of the number of shares and notional tax charge for the financial period from 1 January 2014 to 4 April 2015 was 731.4 million and 21.4% respectively.
£m Q1 (13 weeks) Q2 (13 weeks) H1 (26 weeks) Q3 (13 weeks) Q4 (13 weeks) FY (52 weeks)
Grocery Branded sales 110.1 116.1 226.2 155.0 123.7 504.9 Non-branded sales 16.1 18.4 34.5 20.7 18.1 73.3 Total sales 126.2 134.5 260.7 175.7 141.8 578.2 Divisional contribution
Sweet Treats Branded sales 40.0 40.4 80.4 53.0 45.1 178.5 Non-branded sales 6.0 7.4 13.4 25.2 6.0 44.6 Total sales 46.0 47.8 93.8 78.2 51.1 223.1 Divisional contribution
Group Branded sales 150.1 156.5 306.6 208.0 168.8 683.4 Non-branded sales 22.1 25.8 47.9 45.9 24.1 117.9 Total sales 172.2 182.3 354.5 253.9 192.9 801.3 Divisional contribution
Group & corporate
Trading profit
EBITDA
FY14:
– £325m Fixed notes @6.5% – £175m Floating notes @5.0%+LIBOR
– New and streamlined bank syndicate
Trustees through to 2019
‒ FY15/16 = 3.6x
EBITDA <3.0x
50 100 150 200 250 300 350 2016 2017 2018 2019 2020 2021 £m RCF Floating notes Fixed notes
£m FY15/16 FY14/15
Senior secured notes interest 31 31 Bank debt interest 9 10 Securitisation interest 1 3 Cash interest 41 44 Amortisation and deferred fees 4 4 Net regular interest 45 48
periods
Key IAS 19 assumptions 2 April 2016 4 April 2015 Discount rate 3.55% 3.30% Inflation rate (RPI/CPI) 3.0%/1.9% 3.0%/1.9% Mortality assumptions LTI +1.0% LTI +1.0% £m 2 April 2016 4 April 2015 Assets 4,343 4,248 Liabilities (4,212) (4,460) Surplus/(Deficit) 131 (212) Surplus/(Deficit) net of notional tax 105 (167) Scheme Assets (£m) 2 April 2016 4 April 2015 Equities 405 349 Government bonds 475 547 Corporate bonds 2 330 Property 292 260 Absolute/Target return 1,228 1,333 Cash 327 294 Infrastructure funds 228 196 Swaps 863 430 Private equity 259 251 Other 264 258 Total 4,343 4,248
schemes surplus of £551m partly offset by Premier schemes deficit of £420m
£m 2016/17 2017/18 2018/19 2019/20 Deficit contributions 48 49 44 44 Administration costs (including PPF levy) 8-10 8-10 8-10 8-10 Total cash outflow 56-58 57-59 52-54 52-54
in the context of the Company’s new financial calendar
Pension sensitivities (IAS 19 basis, £m) Increase/ (reduction) in assets Increase/ (reduction) in liabilities Increase/ (reduction) in deficit
25 basis point decrease in government gilts 170 181 11 25 basis point increase in credit spreads
(170) 25 basis point increase in RPI 55 71 16 Life expectancy increase by 1 year
171
£m
2 April 2016 4 April 2015
Property, plant & equipment
188 183
Intangibles / Goodwill
1,145 1,174
Retirement assets
551 242
Investments & loans to associates
Deferred tax
26 42
Non-current Assets
1,910 1,676
Working Capital - Stock
63 69
101 124
(205) (213)
Total Working Capital
(41) (20)
Net debt Gross debt
(542) (630)
Cash
8 45
Total Net debt
(534) (585)
Pension liabilities
(420) (453)
Other net liabilities
(66) (78)
Net Assets
849 540
Share capital & premium
1,489 1,489
Reserves
(640) (949)
Total equity
849 540