Food Security in South Africa Access to and control over the - - PowerPoint PPT Presentation

food security in south africa
SMART_READER_LITE
LIVE PREVIEW

Food Security in South Africa Access to and control over the - - PowerPoint PPT Presentation

Food Security in South Africa Access to and control over the physical, social and economic means to ensure sufficient, safe and nutritious food at all tim es, for all South Africans, in order to meet the dietary requirements for a healthy life


slide-1
SLIDE 1

Food Security in South Africa

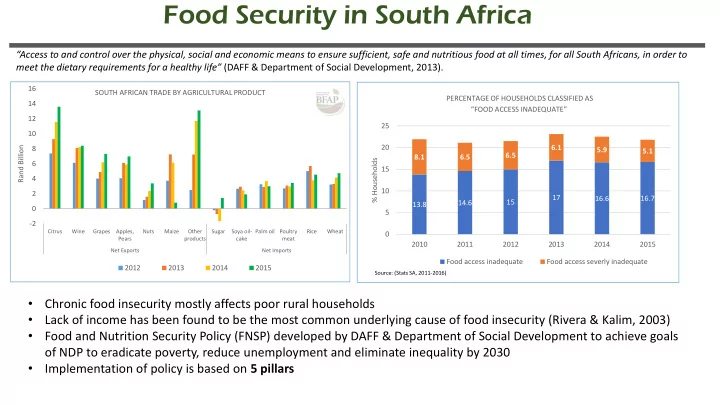
13.8 14.6 15 17 16.6 16.7 8.1 6.5 6.5 6.1 5.9 5.1 5 10 15 20 25 2010 2011 2012 2013 2014 2015 % Households PERCENTAGE OF HOUSEHOLDS CLASSIFIED AS “FOOD ACCESS INADEQUATE” Food access inadequate Food access severly inadequate

Source: (Stats SA, 2011-2016)

“Access to and control over the physical, social and economic means to ensure sufficient, safe and nutritious food at all times, for all South Africans, in order to meet the dietary requirements for a healthy life” (DAFF & Department of Social Development, 2013).

  • 2

2 4 6 8 10 12 14 16

Citrus Wine Grapes Apples, Pears Nuts Maize Other products Sugar Soya oil- cake Palm oil Poultry meat Rice Wheat Net Exports Net Imports

Rand Billion SOUTH AFRICAN TRADE BY AGRICULTURAL PRODUCT 2012 2013 2014 2015

  • Chronic food insecurity mostly affects poor rural households
  • Lack of income has been found to be the most common underlying cause of food insecurity (Rivera & Kalim, 2003)
  • Food and Nutrition Security Policy (FNSP) developed by DAFF & Department of Social Development to achieve goals
  • f NDP to eradicate poverty, reduce unemployment and eliminate inequality by 2030
  • Implementation of policy is based on 5 pillars
slide-2
SLIDE 2

LSM spatial distribution

Source: BFAP, 2016

  • Staple food basket

composition suggests that the dependence on maize meal s staple food is the highest in the Free State, followed by Limpopo, Mpumalanga and the North-West

slide-3
SLIDE 3

Impact of drought on staple servings

Source: BFAP, 2016

  • Based on April 2016 retail

prices, a serving of rice is the cheapest at 37c per serving, followed by maize meal (49c) and then bread (72c).

  • Y-O-Y maize meal inflation the

highest (44%) followed by bread (9%) and rice (6%).

  • Hence, despite of sharp rise in

maize meal prices, still no major shift in staple food consumption patterns expected, which is in line with the BFAP drought report projections in February 2016.

slide-4
SLIDE 4

Impact on staple food price inflation

Source: BFAP, 2016

  • From January 2015 to January

2016 the staple food component within the BFAP healthy baskets increased by R58.

  • From January 2016 up to April

2016 revealed significant further increases in the cost

  • f the staple food component

increasing by a further R118 (to R780)

  • Overall inflation on staple

foods for low income households amounts to 29%

  • 100

200 300 400 500 600 700 800 Jan-15 Jan-16 Apr-16 Projected 2017 prices Cost: Rand per family of four per month

Cost of the staple component within the BFAP 'thrifty' balanced food basket

Maize meal Brown bread Rice White bread Potatoes Wheat flour (cake & bread)

slide-5
SLIDE 5

Source: BFAP (2015) “The Balance of Natural Resources: Understanding the long term impact of mining

  • n food security in South

Africa”

slide-6
SLIDE 6

Source: BFAP (2015) “The Balance of Natural Resources: Understanding the long term impact of mining

  • n food security in South

Africa”