
SLIDE 1
Amit Jardosh, Mock Suwannatat, Tobias Hollerer, Elizabeth Belding, and Kevin Almeroth
UC Santa Barbara
SCUBA
Focus and Context For Mesh Network Health Diagnosis
1
Scenario
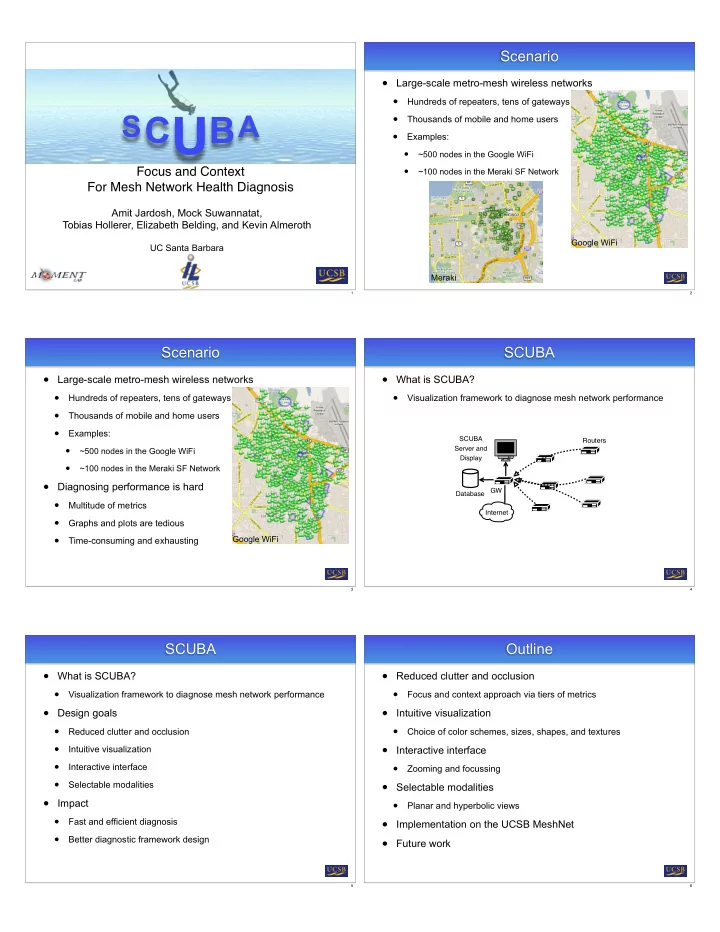
- Large-scale metro-mesh wireless networks
- Hundreds of repeaters, tens of gateways
- Thousands of mobile and home users
Google WiFi Meraki
- Examples:
- ~500 nodes in the Google WiFi
- ~100 nodes in the Meraki SF Network
2
Scenario
- Large-scale metro-mesh wireless networks
- Hundreds of repeaters, tens of gateways
- Thousands of mobile and home users
- Examples:
- ~500 nodes in the Google WiFi
- ~100 nodes in the Meraki SF Network
- Diagnosing performance is hard
- Multitude of metrics
- Graphs and plots are tedious
- Time-consuming and exhausting
Google WiFi
3
SCUBA
- What is SCUBA?
- Visualization framework to diagnose mesh network performance
Internet SCUBA Server and Display Database Routers GW
4
SCUBA
- What is SCUBA?
- Visualization framework to diagnose mesh network performance
- Design goals
- Reduced clutter and occlusion
- Intuitive visualization
- Interactive interface
- Selectable modalities
- Impact
- Fast and efficient diagnosis
- Better diagnostic framework design
5
Outline
- Reduced clutter and occlusion
- Focus and context approach via tiers of metrics
- Intuitive visualization
- Choice of color schemes, sizes, shapes, and textures
- Interactive interface
- Zooming and focussing
- Selectable modalities
- Planar and hyperbolic views
- Implementation on the UCSB MeshNet
- Future work
6