Fish Population Characterization Near the Drop Structure Goals and - - PowerPoint PPT Presentation
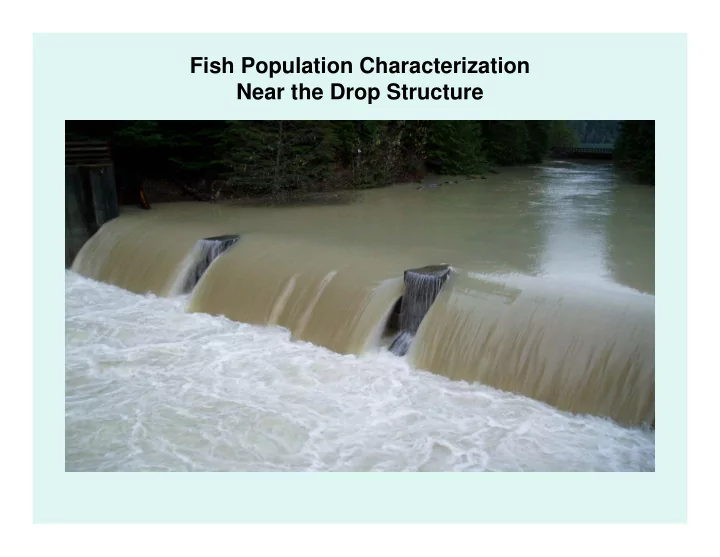
Fish Population Characterization Near the Drop Structure Goals and Objectives Determine the location of the first fish passage barrier downstream of the drop structure Determine the amount of suitable spawning and rearing habitat for
Goals and Objectives
- Determine the location of the first fish passage
barrier downstream of the drop structure
- Determine the amount of suitable spawning and
rearing habitat for rainbow and cutthroat in the isolated reach
- Determine the fish species present in the
isolated reach
- Determine the population size and age/size
structure of all fish species in the isolated reach
- Determine upstream migration timing of any
species present
Methods
- Analysis of Upstream Barrier
– Surveying and Photos
- Quantification of Spawning and Rearing Habitat
– Habitat Characterization (Habitat Typing, Stream widths, Gradients, Substrate Composition, etc.) – Fish Passage Priority Index Calculation
- Fisheries Investigations
– Electrofishing – Length and Weight Measurements
- Determination of Upstream Migration
– Netting below the drop structure
- Literature Review
– Examined potential for injury of fish passing over drop structures during spill events (See Fish Population Characterization Report)
Study Area
- A 1464 ft section of Lake Creek from the
drop structure downstream to the first identified natural barrier.
- This location is consistent with the
physical habitat assessment conducted in 2004.
Analysis of Upstream Barrier
- A definite barrier was located 1464 ft (RM 5.4)
below the drop structure
- The barrier was surveyed in conjunction with
fisheries investigations on 8/23/06
- The barrier possessed an 11.80 ft fall at a base
flow release of 3.5 cfs from the drop structure
- The falls exceeds the leaping capabilities of
rainbow trout and other resident species potentially present in Lake Creek
Barrier at RM 5.4
Barrier
Quantification of Spawning and Rearing Habitat
- Three 30 m study sites (SS) were evenly placed
and surveyed between the drop structure and the barrier at RM 5.4
- A distinct habitat break existed near Study Site 2
downstream of which, gradients increased from approximately 1.40% to 6.20%
- Spawning gravel at all three site comprised less
than 5% of the total substrate
Lake Creek Habitat Characteristics Below the Drop Structure
Calculation of Fish Passage Priority Index
- After all data was collected, a Habitat Quality
Modifier (HQM) was applied to wetted and bankfull width numbers
- Total wetted and bankfull width habitat for
rearing in the isolated reach was determined to be 395.0 m2 and 797.6 m2 respectively
- Total wetted and bankfull width habitat for
spawning in the isolated reach was determined to be 9.1 m2 and 19.6 m2 respectively
Calculation of Fish Passage Priority Index
Calculation of Fish Passage Priority Index (Cont.)
Calculated Priority Indices
Fisheries Investigations
- To assure consistency between this study
and the Fish Species Distribution and Composition Study, fish presence information was gathered at the 3 study sites concurrent with spawning and rearing habitat measurements in August, 2006
- The entire 1464 ft reach was surveyed for
species information on October 17th and 18th, 2006.
August 2006 Sampling Period
- Two electrofishing passes were made at
each study site
- A total of 5 rainbow were captured
– Three at SS#3 (furthest downstream, just above the barrier) – Two at SS#2
- The fish ranged in length from 40 mm to
140 mm and in weight from 1.0 g to 28.0 g
- No other species were observed
August 2006 Fish Sampling Data
Fish Population Characterization Below Drop Structure Rainbow Trout Fork Length vs. Weight (August 2006)
0.0 5.0 10.0 15.0 20.0 25.0 30.0 40 110 120 125 140 Length (mm) W eight (g) Rainbow Trout
October 2006 Sampling Period
- The entire 1464 ft reach was electrofished
- Reaches between 150-200 ft were blocked
- ff with nets and two passes were made
- A total of 12 rainbow were captured
- The fish measured between 70 mm and
165 mm and weighed between 3.7 g and 39.5 g
- No other species were observed
October 2006 Fish Sampling Data
Fish Population Characterization Below Drop Structure Rainbow Trout Fork Length vs. Weight (October 2006)
5 10 15 20 25 30 35 40 45 70 75 75 80 82 115 123 123 125 127 135 165 Length (mm) Weight (g) Rainbow
Length vs. Weight Correlation for Rainbow Trout Captured
Length vs. Weight Correlation for Rainbow Trout Captured Below the Drop Structure (2006)
y = 0.0019x2 - 0.0642x R2 = 0.9699 0.0 5.0 10.0 15.0 20.0 25.0 30.0 35.0 40.0 45.0 20 40 60 80 100 120 140 160 180 Length (mm) W eight (g) Rainbow
- Poly. (Rainbow)
Determination of Upstream Migration Timing
- A fyke net was used to capture fish potentially attempting
an upstream migration near the drop structure
- The net was in place from mid-July through late October,
2006 (Heavy snow and high flows creating overtopping events precluded netting from beginning any earlier)
- Only 1 rainbow measuring 220 mm was captured in the
net
- Multiple overtopping events occurred in May and June
2006
- Many rainbow, (up to 20 at one time), measuring
between 200 mm to 300 mm were observed multiple times near the outflow of the fish flow pipe after
- vertopping had stopped
Fyke Net Location
Work Left To Do
- As conditions allow in 2007: