Findings assessment CLLD strategy Salomon Espinosa Matthieu Chau - - PowerPoint PPT Presentation

findings
SMART_READER_LITE
LIVE PREVIEW

Findings assessment CLLD strategy Salomon Espinosa Matthieu Chau - - PowerPoint PPT Presentation

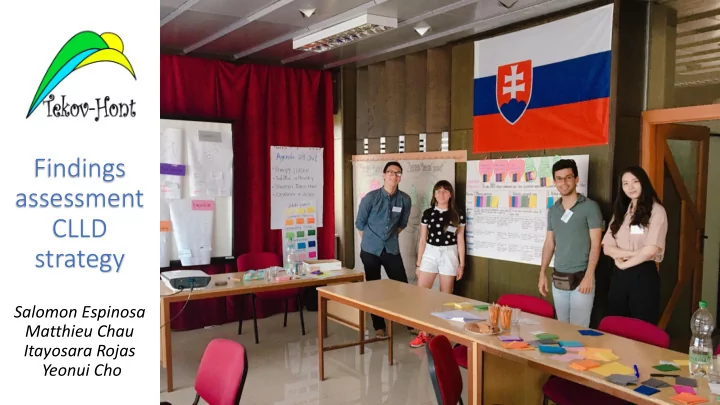
Findings assessment CLLD strategy Salomon Espinosa Matthieu Chau Itayosara Rojas Yeonui Cho 2 Objectives of the Case Study To learn how to design the evaluation framework for assessment of added value of LEADER/CLLD Define and


slide-1
SLIDE 1

Findings assessment CLLD strategy

Salomon Espinosa Matthieu Chau Itayosara Rojas Yeonui Cho

slide-2
SLIDE 2

2

slide-3
SLIDE 3

Objectives of the Case Study

3

  • To learn how to design the evaluation framework for assessment of added

value of LEADER/CLLD

  • Define and Formulate the evaluation framework for expected added

value

  • Understand how the added value is linked with the LEADER/CLLD

strategy, delivery mechanism, the CLLD method and conduct the relevant assessment

slide-4
SLIDE 4

Assessment process

4

WEEK 1 WEEK 2 WEEK 3 WEEK 4 Collection of information: Slovakia, Common agriculture policy, LEADER in Slovakia. Training in the assessment of the CLLD strategy: Tools, CLLD matrix, focus group, interview design. Assessment in Tekov Hont. Interview with the LAG manager, focus group with members of the LAG. Results analysis: final presentation, final report.

slide-5
SLIDE 5

Territory description

  • Date of establishment : 2012
  • Area : 666.58 Km2
  • Number of municipalities : 43
  • Location : Southeastern part of Nitra

(includes the northern part of the Levice area)

  • Population : 28,540 (as of 31.12.2014)
  • Main activity : Agriculture, Livestock

breeding, Wine- Apple- Pear production, etc.

5

slide-6
SLIDE 6

Description of the assessment process

6

1) 1) Pictiona tionary ry

  • Purpose : To easily understand the definition of the 7 principles.
slide-7
SLIDE 7

2) 2) Pears s and Apples es

  • Purpose : To help the focus groups easily approach to the expected AV

7

slide-8
SLIDE 8

3) 3) Strategy tegy Table e Filling ng

  • Purpose : To understand how principles are linked to the strategy and the AV

8

slide-9
SLIDE 9

4) 4) Conclus usion

  • n Table
  • Purpose : To show the relationship between the expected AV, the priorities and the

principles.

9

slide-10
SLIDE 10

What do people think about the principles? How do they understand principles?

Integrated Actions:

  • Easy life/ easy way
  • Connection
  • Joint
  • Regional ideas
  • No repetition
  • Together

10

Bottom up:

  • People’s will
  • Democracy
  • Rising up

Area Based Strategies:

  • Natural conditions
  • Comunidad
  • Tradición
slide-11
SLIDE 11

Networking:

  • Communication
  • Interlinks
  • Knowledge

transference

  • Relationship building

Cooperation:

  • Group / Community
  • Consensus / Meetings
  • Support / Better idea

11

Partnership:

  • Merge / Linking
  • Cohesion
  • Help
  • Easy goals

Innovation:

  • Ideas / New
  • Creativity
  • Science
slide-12
SLIDE 12

What do people expect as an added value?

12

slide-13
SLIDE 13

What do people expect as an added value?

In terms of Social Capital: · Improved Quality of life of Inhabitants · More successful people in business · Local confidence (trust) In terms of Improved Local Governance: · Local government close to the people · Increase participation of people in decision making · Better level of local identity

13

slide-14
SLIDE 14

How do people link principles and added value with their own strategy?

14

1) 1) Prin rincip iple an and prio riorit ity 2) 2) Prin rincip iple an and ad added valu alue 3) 3) Con

  • nclu

lusion tab able le

slide-15
SLIDE 15

Principles and priorities

15

Priority 1: Local Business Priority 2: Rural tourism Priority 3: The appearance of municipalities and small infrastructure Priority 4: Social entrepreneurship, service and education Total

  • 1. Area-based:

3 3 3 3 12

  • 2. Bottom-up:

3 3 3 3 12

  • 3. Public-private

partnership:

2 2 1 3 8

  • 4. Innovation:

3 3 1 1 8

  • 5. Integration:

2 2 1 5

  • 6. Networking:

1 1 2

  • 7. Co-operation:

1 2 1 2 6

Total

15 16 10 12

slide-16
SLIDE 16

Principles and Added Value

16

Principle Added value 1 Added value 2 Added value 3 Added value 4 Added value 5 Added value 6

  • 1. Area-based:

x x x x x x

  • 2. Bottom-up:

x x x x x

  • 3. Public-private partnership:

x x x x x x

  • 4. Innovation:

x x x

  • 5. Integration:

x x x x x x

  • 6. Networking:

x x x x x x

  • 7. Co-operation:

x x x x x Total 5 6 6 7 7 6

slide-17
SLIDE 17

Conclusion Table

17

Added value 1 Added value 2 Added value 3 Added value 4 Added value 5 Added value 6 Total cards

Total Value

Priority 1: Local Business 3 3 2 2 1 3 2 3 2 1 1 3 3 2 2 1 1 3 3 2 3 2 1 1 3 3 2 3 2 1 1 3 3 2 2 1 1 37

77

Priority 2: Rural tourism 3 3 2 2 1 3 2 3 2 1 2 3 3 2 2 1 2 3 3 2 3 2 1 2 3 3 2 3 2 1 2 3 3 2 2 1 2 37

82

Priority 3: The appearance

  • f municipalities and small

infrastructure 3 3 1 1 3 1 1 1 1 3 3 1 1 1 3 3 1 1 1 1 3 3 1 1 1 1 3 3 1 1 1 31

53

Priority 4: Social entrepreneurship, service and education 3 3 3 3 3 1 2 3 3 3 2 3 3 3 1 2 3 3 3 1 2 3 3 3 2 25

64

Total cards 17 21 21 25 25 21 130

276

Total Value 39 41 45 53 53 45 276

slide-18
SLIDE 18

LAG Manager's interview

  • Predominant dominance of public sector
  • Financial problems
  • Re-adjustment of the strategy
  • Frustration among stakeholders
  • Different work rhythms among stakeholders: entrepreneurs

18

slide-19
SLIDE 19
  • Classification among stakeholders: First criteria: Cooperation,

willingness to cooperate with the LAG and with the programme.

  • Composition: 10 entrepreneurs, 43 Mayors and individuals.
  • Training with the national network of rural development.

19

slide-20
SLIDE 20

To what extent is the CLLD strategy fostering /weakening the generation of social capital and enhancement of local governance in the LAG territory?

20

Fostering Weakening Human resources/ Human capital: abilities and skills of LAG staff, enthusiasm Financial problems People´s Commitment Waiting time/ implementation time Public offices Commitment: mayors Different work paces from different stakeholders: entrepreneurs

slide-21
SLIDE 21

To what extent is the delivery mechanism fostering/weakening the generation of social capital and enhancement of local governance capital in the LAG territory?

21

Fostering Weakening Human resources/ Human capital: clear understanding of LEADER programme, principles and mechanisms Procedures to adjust the strategy: financial problem Procedures from the national level to access financial capital and implement the strategy

slide-22
SLIDE 22
  • In Tekov Hont there has been a higher involvement of the public

sector through the municipalities.

  • There has been different paces and levels of contribution among

stakeholders, particularly the case of entrepreneurs.

  • There is a generalised feeling of frustration and demotivation that

can be perceived due to the delay in the access to LEADER budget.

  • Tekov Hont has a big socio economic potential in terms of wine

production, cultural heritage and recreation.

22

slide-23
SLIDE 23

Conclusions

  • Trough the assessment process in Tekov-Hont we are able to have

a better understanding of the rural areas in Slovakia: complexity, potential and problems.

  • The use of participatory tools during the assessment process helps

to understand better LEADER principles and boost them.

  • The application of the tools during the assessment in Tekov-Hont

allowed us to evaluate their strengths and weaknesses.

  • Focus group and manager´s interview are complement tools.

23

slide-24
SLIDE 24

Recomendations

  • The tool is complex and need to be well explain
  • The tool may has to be adjust to fit the time and capacity of

the users

  • The tool is relevant to be used while building a strategy to

assess the added value expected but can not be used to compare the different LAG due to the subjetivity

24

slide-25
SLIDE 25

Thank you!

25