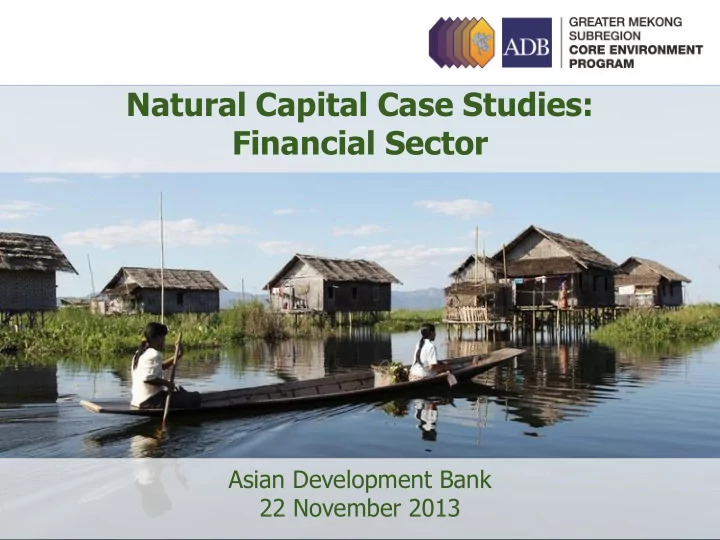

Natural Capital Case Studies: Financial Sector Asian Development Bank 22 November 2013
Outline The GMS Economic Cooperation Program Implications for the Transboundary Biodiversity Landscapes The GMS Core Environment Program
GMS Economic Cooperation Program in a Nutshell • Participating Countries: Cambodia, PR China, Lao PDR, Myanmar, Thailand, Viet Nam • Strategic Priorities: Vision – a more integrated, prosperous, and harmonious subregion “3 Cs” – Connectivity, Competitiveness, Community • GMS investments – total $15.5 billion by the end of 2012 3
• Roads • Telecommunications • Power Transmission Line Infrastructure Development in GMS (1992) 4
• Roads • Telecommunications • Power Transmission Line Infrastructure Development in GMS (2010) 5
• Roads • Telecommunications • Power Transmission Line Infrastructure Development in GMS (2015 ‒2020 ) 6
In this period … GDP has grown 14% 12.0% 12% Average GDP growth rate, 1992-2011 10.5% 10.2% 10% 9.0% 8.1% 8% 7.4% 7.4% 6.8% 6% 4.0% 4% 2% 0% GMS Cambodia Guangxi Yunnan PRC Lao PDR Myanmar Thailand Viet Nam Zhuang Province, Autonomus PRC Region, 7 PRC Source: IMF, World Economic Outlook Database.
As has trade… 180 Viet Nam 160 140 Trade to GDP ratio (%) 120 Cambodia 100 Thailand Lao PDR 80 60 40 PRC 20 Myanmar 0 1992 1993 1994 1995 1996 1997 1998 1999 2000 2001 2002 2003 2004 2005 2006 2007 2008 2009 2010 2011 8 Source: WB, World Development Indicators Online.
Growth accompanied by decline in poverty… 70 63.8 63.7 Poverty rate (% of poulatiob below $1.25 (PPP)-a-day) 60 55.7 50 44.5 40 33.9 30 22.8 20 16.9 13.1 8.6 10 0.4 0 1994 2008 1992 2008 1992 2008 1992 2009 1993 2008 Cambodia PRC Lao PDR Thailand Viet Nam 9 Source: WB, World Development Indicators Online.
..and improvement in human development 1 0.9 0.8 Human Development Index 0.69 0.68 0.7 0.59 0.57 0.6 0.52 0.52 0.48 0.48 0.5 0.44 0.41 0.38 0.4 0.30 0.3 0.2 0.1 0 1995 2011 1990 2011 1990 2011 1990 2011 1990 2011 1990 2011 Cambodia PRC (101) Lao PDR (138) Myanmar Thailand (103) Viet Nam (139) (149) (128) 10 Source: UNDP Human Development Report (2011).
New GMS Strategic Framework (SF) 2012-2022 4 th GMS Summit, December 2011 Regional Investment Framework (RIF) 19 th GMS Ministerial Conference, December 2013 Investment Pipeline and Knowledge Products Multisector approach; Institutional Evolution Sector Assessments/Country Priorities 11
Outline GMS Economic Cooperation Program Implications for the Transboundary Biodiversity Landscapes The GMS Core Environment Program
Natural Capital of the Greater Mekong – a valuable asset • GMS is one of the most biologically diverse places on earth • High species diversity and endemism • Mekong river system supports the world’s largest and most productive inland fishery 13
… but under high pressure • About a third of the forest cover lost between 1973 and 2009; degradation accounts for further losses • Significant decline in biodiversity • Fish supply from Mekong river could be cut by 40% due to hydropower projects • Land degradation affects between 10% and 40% of land in the GMS 14
Outline GMS Economic Cooperation Program Implications for the Transboundary Biodiversity Landscapes The GMS Core Environment Program
Promoting Regional Cooperation for Sound Environmental Management Regional: environment ministries of Cambodia, PRC, Lao PDR, Myanmar, Thailand, and Viet Nam Secretariat: Core Environment GMS Environment Program (CEP) Operations Center Multi-donor: $28.4 million from the Governments of Finland and Sweden, Nordic Development Fund, and ADB 16
CEP at its heart . . . • Secure natural capital Prosperity (ecosystem assets and services) • Optimize allocation of scarce resources and Creating opportunities manage competition Creating opportunities Reinvesting • Enhance efficiency of Reinvesting supply chains based on scarce resources • Improve inclusiveness Managing risks and equitable benefit- sharing • Promote integrated management of resources across international borders
Some Ongoing Assessments • Spatial Multi-Criteria Analysis • Economics of Ecosystem Services and Natural Capital • Biodiversity Landscape Assessment • Climate Vulnerability and Risk Assessment 19
Spatial Multi-Criteria Analysis Criteria Tree Output: Environmental risk map, at 1km resolution. Low values ( 0) indicate high accumulated risk, while high values ( 1) indicate low accumulated risk. 20
Environmental Risk, by district (mean value) Ecosystem Service Potential 21
Some Ongoing Assessments • Spatial Multi-Criteria Analysis • Economics of Ecosystem Services and Natural Capital • Biodiversity Landscape Assessment • Climate Vulnerability and Risk Assessment 22
Thank you For further information www.gms-eoc.com
Recommend
More recommend