
SLIDE 1
1/23/2010 1
Data Mining in Business Intelligence
Professor Hui Xiong
I/UCRC Center for Dynamic Data Analytics Rutgers University
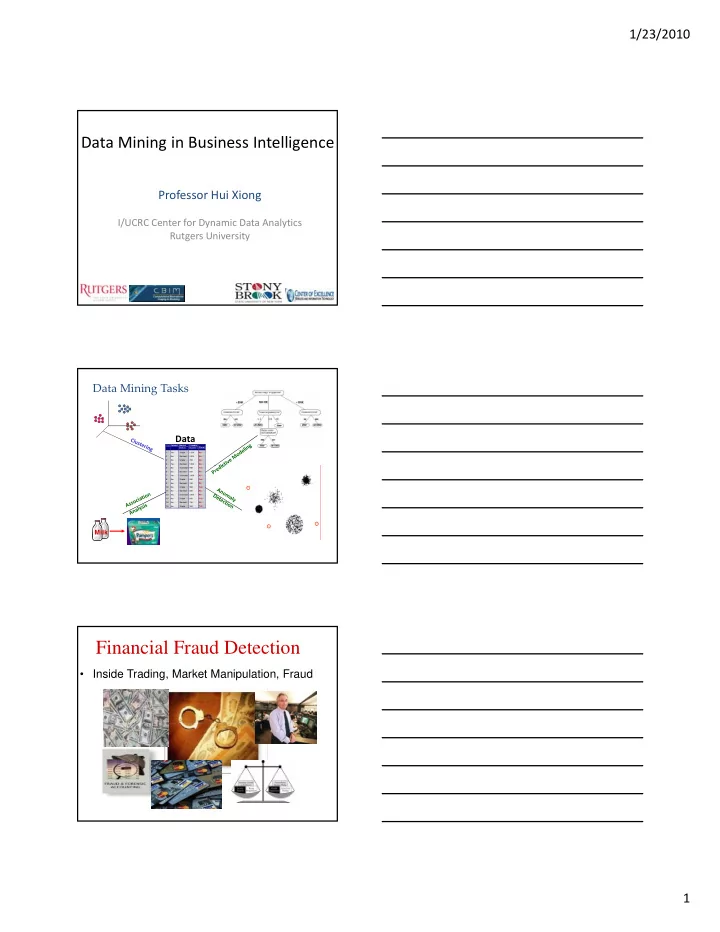
Tid Refund Marital Status Taxable Income Cheat 1 Yes Single 125K No 2 No Married 100K No 3 No Single 70K No 4 Yes Married 120K No
Data
Data Mining Tasks
5 No Divorced 95K Yes 6 No Married 60K No 7 Yes Divorced 220K No 8 No Single 85K Yes 9 No Married 75K No 10 No Single 90K Yes 11 No Married 60K No 12 Yes Divorced 220K No 13 No Single 85K Yes 14 No Married 75K No 15 No Single 90K Yes
1 0Milk
Financial Fraud Detection
- Inside Trading, Market Manipulation, Fraud