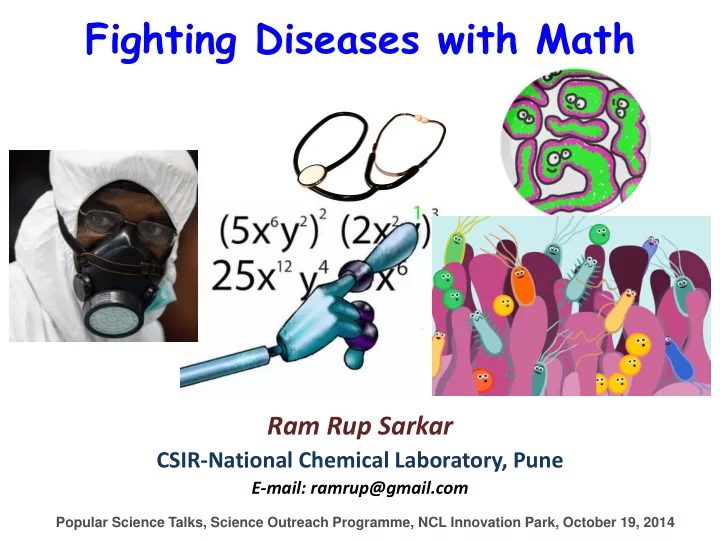
SLIDE 1 Fighting Diseases with Math
Ram Rup Sarkar
CSIR-National Chemical Laboratory, Pune
E-mail: ramrup@gmail.com
Popular Science Talks, Science Outreach Programme, NCL Innovation Park, October 19, 2014
SLIDE 2
SLIDE 3 Today’s Recipe…
Maths and Biology Application of Mathematics on different Biological Problems Mathematical Models Introduction to Diseases Historical Perspective How Mathematical Principles explains the spread of Diseases A simple Mathematical Model Different Models to Fight against Diseases What we do…
SLIDE 4 But the situation has substantially changed and they may study Biological Science along with Mathematics
Biology and Mathematics have been somewhat mutually exclusive Challenging aspects of Biological Research are stimulating innovation in Mathematics and it is feasible that Biological Challenges will stimulate truly novel Mathematical Ideas as much as physical challenges have
SLIDE 5 In the common view of the sciences, Physics and Chemistry are thought to be heavily dependent on Mathematics While Biology is often seen as a science which only in a minor way leans
A large part of the scientific community is rethinking biology education, which apparently needs to undergo mutation, one that is induced by mathematics.
SLIDE 6 Even if a biologist is missing the math gene, as this cartoon shows, one has little choice if a serious career in biology is to be made
SLIDE 7 Mathematics in Physics and Biology
- Most physical processes are well described by ―physical
laws‖ valid in a wide variety of settings. – It is easy to get physical science models right.
- Most biological processes are too complicated to be
described by simple mathematical formulas. – It is hard to get good mathematical laws/rule/model for biology. – A model that works in one setting may fail in a different setting. Mathematical modeling requires good scientific intuition - Scientific intuition can be developed by observation. Detailed observation in biological scenarios can be very difficult or very time-consuming, so can seldom be done in a math course.
SLIDE 8 Mathematics Has Made a Difference
Example: Population Ecology
Snowshoe Rabbit
predicted by a mathematical model
SLIDE 9 Classical Predator/Prey (Lynx and Rabbits)
Suppose we have a population of Lynx and a population of Rabbits, and We wish to build a mathematical formula to describe how the numbers of specimen in each population will change over time based on a few preliminary assumptions. Let us make the following assumptions:
- In the absence of Lynx, Rabbits (R) will find sufficient food
and breed without bound at a rate proportional to their population
- In the absence of Rabbits, Lynx (F) will die out at a rate
proportional to their population
- Each Lynx/Rabbit interaction (R-F) reduces the Rabbit and
increases the Lynx population (not necessarily equally)
- The environment doesn‘t change or evolve
SLIDE 10 F = number of Lynx and R = number of Rabbits
D R = A R
Change in Rabbit pop.
Rabbit net growth (birth - natural death) Rabbit-Lynx interaction (decrease due to predation)
A, B, C and D are constant rates
Classical Predator/Prey (Lynx and Rabbits)
– B RF D F = - C F
Change in Lynx pop.
Lynx death Rabbit-Lynx interaction (increase due to predation/consumption)
+ D RF
Mathematical Formula / Expression (Model)
SLIDE 11 With 100 initial Rabbits and 50 initial Lynx.
Classical Predator/Prey (Lynx and Rabbits) DR = A R – B RF D F = - C F + D RF
F = number of Lynx R = number of Rabbits
Time (years)
Mathematical Expression (Model)
SLIDE 12 Patterns in Nature
and diffuse in animal coats make visible patterns
time t location x.
Mathematical Expression (Model)
SLIDE 13 Mathematics Has Made a Difference
Example: Biological Pattern Formation
- How did the leopard / giraffe /
zebra get their spots?
predict all of these patterns?
SLIDE 14 Mathematics Has Made a Difference
Example: Electrophysiology of the Cell
- In the 1950‘s Hodgkin and
Huxley introduced and designed the first model to reproduce cell membrane action potentials
- They won Nobel Prize for this
work and a new field of mathematics — excitable systems, sparked out from this
- J. Physiol. (I952) II6, 449-472
SLIDE 15 Mathematical model Parameters estimation Simulation Experiments, data
Mathematical Models
Mathematical model is a well-defined mathematical object consisting of a collection of symbols, variables and rules (operations) governing their values. Models are created from assumptions inspired by
- bservation of some real phenomena in the hope that the
model behavior resembles the real behavior.
SLIDE 16 Curve Fitting and Simulation
- Using data to obtain parameter values by curve fitting.
– There is an underlying model in curve fitting or parameter determination, but the mathematical model can also be assumed for generality
- Using a computer to predict the behavior of some real
scenario through the model simulation.
– Simulation involves computation with an assumed model.
How Are Models Derived?
- Start with at problem of interest
- Make reasonable simplifying assumptions
- Translate the problem from words to
mathematically/physically realistic statements of balance or conservation laws
SLIDE 17 The Modeling Process
SLIDE 18 Why is it Worthwhile to Model Biological Systems
- To help reveal possible underlying mechanisms involved in a
biological process
- To help interpret and reveal contradictions/incompleteness of
data and confirm/reject hypotheses
- To predict system performance under untested conditions
- To supply information about the values of experimentally
inaccessible parameters
- To suggest new hypotheses and stimulate new experiments
SLIDE 19 Some topics in Mathematical Biology
- Ecological Models (large scale environment --- organism
interplay; Structured populations; Predator-prey dynamics; Resource management)
- Organism Models
- Large and Small Scale Models (Epidemiology/Disease)
- Cellular Scale (Wound healing; Tumor growth; Immune System)
- Quantum/molecular Scale (DNA sequencing; Neural networks)
- Pharmacokinetics (Target Identification; Drug Discovery)
- The effect of bacteria on wound angiogenesis
- Zoonotic diseases carried by rodents: seasonal fluctuations
- Computational modeling of tumor development
- Hepatitis B disease spread
- System Biology
Some interesting current studies
SLIDE 20 What is disease?
Disease is a disorder or malfunction of the mind
- r body, which leads to a departure from good health.
Can be a disorder of a specific tissue or organ due to a single cause. E.g. Measles, Chicken Pox, Malaria, HIV etc. May have many causes. Often referred to as multifactorial. E.g. heart disease.
Now Diseases………….
Measles Chickenpox
Acute disease Sudden and rapid onset Symptoms disappear quickly E.g. Influenza Chronic disease Long term Symptoms lasting months or years E.g. Tuberculosis
SLIDE 21 Infectious diseases Organisms that cause disease inside the human body are called pathogens Diseases are said to be infectious or communicable if pathogens can be passed from one person to another.
Physical disease Results from permanent or temporary damage to the body
Categories of diseases
Bacteria and Viruses are the best known pathogens. Fungi, protozoa and parasites can also cause diseases
Mycobacterium Tuberculosis Influenza virus Aspergillus fumigatus Plasmodium falciparum
SLIDE 22 2000-2012: On an average 2% of the entire population of India tested positive for Malaria, 2012: Total new and relapse cases of TB – 12,89,836; Total cases notified-14,67,585 Each year in the United States, 5% to 20% of the population gets the flu and 36,000 die Infectious diseases are big problems in India and worldwide, for people of all ages, as well as for livestock. 2005: More than 130,000 cases of cholera occur worldwide 2006: More than 350,000 cases of gonorrhea are reported in the United States 2007: 33.2 million people worldwide have HIV infections
Infectious Diseases Are Big Problems
Source: World Health Organization (http://www.who.int/en/)
SLIDE 23 The Antonine Plague, 165–180 AD, was an ancient pandemic, either of smallpox or measles, brought back to the Roman Empire by troops returning from campaigns in the Near-East -
Invaded the Roman Empire, claimed lives of two Roman emperors and caused drastic population reduction and economic hardships [Wikipedia (2008)].
Historical perspective
In the early 1500s, smallpox was introduced into the Caribbean by the
Spanish armies led by Cortez, from where it spread to Mexico, Peru, and Brazil
- One of the factors that resulted in widespread deaths among the Incas.
- The population of Mexico was reduced from 30 million to less than 2 million during a
period of 50 years after the Spanish invasion [Brauer and Castillo-Chavez (2001)]
The Black Death (bubonic plague) had spread four times in Europe
- Death of more than 10 000 people every
day in 600 AD, and death of as much as
- ne-third of the population between 1346
and 1353.
- The disease recurred regularly in various
parts of Europe and, led to the death of
- ne-sixth of the population in London
between 1665 and 1666.
Source: Wikipedia
SLIDE 24
- Great progresses had been achieved, especially during the
20th century
- While smallpox outbreaks have occurred from time to time for
thousands of years, the disease is now eradicated after a successful worldwide vaccination program [HHS (2008)].
- In 1991,World Health Assembly passed a resolution to
eliminate leprosy - The target was achieved on time [WHO (2008)].
- Poliomyelitis (polio) - the Global Polio Eradication Initiative
was launched in 1988, Internationally coordinated public health project to date — In 2006, less than 2000 cases were reported [WHO (2008)].
SLIDE 25
- Some other infectious diseases, such as diphtheria, measles, pertussis,
and tetanus (lockjaw), have been significantly under control in many countries.
- While the great achievement and progresses in the prevention and
control of infectious diseases are promising and inspiring, there is a long way to go to completely eradicate infectious diseases in the world.
- An estimated 1.5 million people died from tuberculosis in 2006 [WHO
(2007)].
- Malaria - the world‘s most important tropical parasitic disease.
Approximately, 40% of the world‘s population, mostly those living in the world‘ poorest countries, are at risk of malaria.
SLIDE 26 Global Statistics
40% of the world's population is at risk 300-500 million new cases/year 1.5-2.7 million deaths/year Malaria is endemic to over 100 countries and territories More than 90% of all cases are in sub- Saharan Africa
SLIDE 27 In addition to frequently occurring disease epidemics, the threat of emergence
re-emergence of new epidemics continues to be a concern for policy makers and the public health services.
SLIDE 28
- Epidemic dynamics study is an important theoretic approach to investigate
the transmission dynamics of infectious diseases It formulates mathematical models to describe the mechanisms of disease transmissions and dynamics of infectious agents.
- Mathematical models are based on population dynamics, behavior of disease
transmissions, features of the infectious agents, and connections with other social and physiologic factors. Research in Infectious Diseases Descriptive Analytic Experimental Theoretic
SLIDE 29 Mathematical models give good understanding of how infectious diseases spread, and identify more important and sensitive parameters, make reliable predictions and provide useful prevention and control strategies and guidance. Help us to make more realistic simulations and reliable long-term transmission prediction which may not be feasible by experiments or field studies. “ Modeling can help to ...
Modify vaccination programs if needs change Explore protecting target sub-populations by vaccinating others Design optimal vaccination programs for new vaccines Respond to, if not anticipate changes in epidemiology that may accompany vaccination Ensure that goals are appropriate, or assist in revising them Design composite strategies,… ” Walter Orenstein, Former Director of the National Immunization Program in the Center for Diseases Control (CDC)
SLIDE 30
- Mathematical modeling of infectious diseases can be traced
back to 1760 when Bernoulli used mathematical models for smallpox [Bernouilli (1760)],
- 20th century: Hamer formulated a discrete-time model for
the spread of measles in 1906.
- Sir Ronald Ross (1911) - transmissions of malaria between
human beings and mosquitoes , and determined a threshold of the size of mosquitoes below which the spread of malaria can be
- controlled. (Second Nobel Prize in Medicine)
- Kermack and McKendrick formulated a well-
recognized SIR (susceptible–infective–recovered) compartmental model, in 1926, to study the outbreak
- f Black Death in London during the period of 1665–
1666, and the outbreak of plague in Mumbai in 1906.
- They later, in 1932, formulated an SIS compartment
model and, formally introduced the concept of thresholds that determines whether a disease spreads in a given population
SLIDE 31
- More intensive studies on epidemic dynamics took place after the middle
- f the 20th century.
- A landmark publication is the book by Bailey (first edition in 1957; second
edition in 1975)
- More developments and progresses - during the past 20 years.
- Massive mathematical models have been formulated and developed to
study various infectious diseases, ranging from more theoretic to general ones [Waltman (1974); Burnett and White (1974); Hoppensteadt (1975); Frauenthal (1980); Anderson and May (1982); Evans (1982); Webb (1985); Kranz (1990); Busenberg and Cooke (1993); Capasso (1993); Isham and Medley (1996); Daley and Gani (1999); Diekman and Heesterbeek (2000)] more specific ones e.g. measles, malaria, tuberculosis, sexually transmitted diseases (STD), or AID/HIV [Hethcote and Yorke (1984); Hethcote (2000); Hyman and Stanley (1988); Brauer and Castillo- Chavez (2001); Brauer et al. (2008)].
SLIDE 32 Modeling Has Made A Difference
Example: Tumor Growth
models have been developed that describe tumor progression and help predict response to therapy.
SIAM REVIEW Vol. 49,No . 2,pp . 179–208
SLIDE 33 Let us try to understand a mathematical model……
Spread of Infection in a population
SLIDE 34 Epidemiology
- Deals with one population
- Risk case
- Identifies causes
Infectious disease epidemiology
Two or more populations A case is a risk factor The cause often known
Infectious Disease Epidemiology
Two or more populations Humans Infectious agents Helminths, bacteria, fungi, protozoa, viruses, prions Vectors Mosquito (protozoa-malaria), snails (helminths- schistosomiasis), Sand Fly (Leishmania-KalaAzaar) Animals Dogs and sheep/goats – Echinococcus Mice and ticks – Borrelia
SLIDE 35 Timeline for Infection
SLIDE 36 Transmission
Factors Influencing Disease Transmission
Agent Host Environment
- Age
- Sex
- Genotype
- Behaviour
- Nutritional status
- Health status
- Infectivity
- Pathogenicity
- Virulence
- Immunogenicity
- Antigenic stability
- Survival
- Weather
- Housing
- Geography
- Occupational setting
- Air quality
- Food
SLIDE 37 Infectivity (ability to infect)
(number infected / number susceptible) x 100
Pathogenicity (ability to cause disease)
(number with clinical disease / number infected) x 100
Virulence (ability to cause death)
(number of deaths / number with disease) x 100
All are dependent on host factors
Epidemiologic Triad-Related Concepts All are numbers…………..MATH Again…
SLIDE 38 Calculation of the Basic Reproductive Ratio, R0
For a microparasitic infection, R0 is more preciously defined as the average number of secondary infections produced where one infected individual is introduced into a host population, where everyone is susceptible.
SLIDE 39 Definitions
SLIDE 40
SLIDE 41 Typical Transmission Factors
SLIDE 42 A First Model
V x r dt dx
Change Time
V x r Time Change
Density
Change Time
In this case: LOSS @ r; Density = Mass/Volume
e is an important mathematical constant (Approx. = 2.71828) r
r V x
SLIDE 43 Compartments & Flow
x1 x2 x3
r r r
V1 V2 V3
1 1
1 V x r density in Loss Time Vessel st in Change
2 2 1 1
1 nd 2 V x r V x r density in Loss st from Gain Time Vessel in Change
Changes in Concentration
3 3 2 2
nd 2 rd 3 V x r V x r density in Loss from Gain Time Vessel in Change
Mathematical Expression (Model)
SLIDE 44 Evaluate the Model
- Choose some parameters
- V1 = 80
- V2 = 100
- V3 = 120
- r = 20
- Define the initial conditions
- x1(0) = 10
- x2(0) = 0
- x3(0) = 0
http://math.fullerton.edu/mathews/N310/projects2/p14.htm (read from “More Background” onwards)
Results
SLIDE 45 Susceptible pool of people
S
Infected pool of people
I
Recovered pool of people
R
Infected Individuals
Basic Model for Infectious Disease
SLIDE 46 S I R
βSI I
Infection Rate:
Contact rate Infection probability
Recovery Rate
If D is the duration
= 1/D
SI dt dS S in Change Time
I SI dt dI Time I in Change I dt dR Time R in Change
Kermack–Mckendrick SIR compartment model For viral diseases, such as influenza, measles, and chickenpox, the recovered individuals, in general, gain immunity to the same virus.
SLIDE 47 A “typical” flu epidemic
- Each infected person infects a susceptible every 2 days so β =1/2
- Infections last on average 3 days so =1/3
- London has 7.5 million people
- 10 infected people introduced
SLIDE 48 Changes to Infection Rate
β =1/2 =1/3 β =1/1.5 =1/3
SLIDE 49 Let us calculate the Basic Reproduction Number, R0
S0 = Initial Susceptible Population
β= Rate of Infection = Rate of Recovery
the epidemic spreads when R0 > 1 and dies out when R0 < 1.
Most of the cases, β and , are unknown
Alternative way to calculate, K = S0 + I0 FIND: S0 = Initial Susceptible Population I0 = Initial Infected Population FIND: S∞ S∞ = Final Susceptible Population OR Number of Survival MATH AGAIN…..CALCULATE: ln(x) is called natural logarithm of a number x. For example: ln(2) is 0.69314..., because e0.69314...= 2, e is an important mathematical constant (Approx. = 2.71828)
SLIDE 50 Example: The village of Eyam near Sheffield, England suffered an outbreak of bubonic plague in 1665–1666 [Brauer and Castillo-Chavez (2001)]. Preserved records show that the initial numbers of susceptibles and infectives were 254 and 7 in the middle of May 1666, respectively. and only 83 persons survived in the middle
The parameters can be estimated as
S0 = 254, I0 = 7, S∞ = 83, K = S0 + I0
so that
ρ = 153 = 261, R0 = S0/ρ
The records also show that the Infective period was 11 days (D)
= 1.66
One can calculate, = 1/D = 1/11
(/ Day) (/ Month)
SLIDE 51 General Framework
SLIDE 52 Environment Pathogens Human
SLIDE 53 Fundamental forms of compartment models
When a disease, such as influenza, measles, rubella,
chickenpox, spreads in a population rapidly, for a relatively short time, usually the vital dynamic factors, such as birth and natural death of the population, can be neglected in the models.
Models without vital dynamics Models with vital dynamics SIR model without vertical transmission SIR model with vertical transmission
In this model, we assume that the disease is not inherited from parents to their new generations, so that all the newborns are susceptible. For many diseases, such as AIDS, hepatitis B, and hepatitis C, newborns from the infected individuals can be infected as well. Such transmission is called vertical transmission.
SLIDE 54 Epidemic Models with Various Factors Epidemic models with latent period Epidemic models with time delay Epidemic models with prevention, control, or treatment Models for interacting populations in a community Models with vector-host, Malaria, Leishmania etc. Models with Age-structure
SLIDE 55 Models with Vector-Host Ross Model on Malaria dx
dt dy
dt
x: proportions of the infected human populations, y: proportions of the infected female mosquito populations a: bite rate of a single mosquito; c: prop. of bites by suscpt. mosq. on
- inf. people that produce a patent
infection;
: individual recovery rate per human;
: ind.death rate for mosq.; = abM/N, N & M are the (constant) sizes of the human and female mosq. poplns. resp.; b: prop. of inf. bites that produce an infection;
SLIDE 56 Modifications are (almost) endless
Susceptible Exposed Infected Recovered SEIR Susceptible Carrier Infected Recovered Carrier Type Diseases: TB, Typhoid
SLIDE 57 Legrand et al. 2004, Epidemiol Infect, vol 132, pp19-25 Uninfected contacts (located) Vaccinated successfully Exposed contacts (missed) Susceptible Infectious Removed Exposed contacts (located) Quarantine
SLIDE 58 Mathematical Models are applied to real situations to gain an understanding of medical and health issues
Examples:
Scientists are developing computer models to combat infectious diseases such as spread of H5N1 strain of the avian influenza virus. Scientists are studying global warming through the use of computer models to simulate temperatures and rainfall in order to predict environmental-based health risks such as cardiac and respiratory problems. Teams of physical chemists have been using computer models to study brain that could help to understand Alzheimer’s disease.
SLIDE 59 Kind of outcomes from models
- Prediction of future incidence/prevalence under different
vaccination strategies/”scenarios”: – age at vaccination, – population – vaccine characteristics – …
- Estimate of the minimal vaccination coverage / vaccine
efficacy needed to eliminate disease in a population
SLIDE 60 Also……there are application of mathematics to combat diseases at Molecular, Cellular and Tissue/Organ levels
Major events in the history of Molecular Biology
- 1986 Leroy Hood: Developed automated sequencing
mechanism
- 1986 Human Genome Initiative announced
Leroy Hood 1986 - 1995 1995-1996
- 1995 John Craig Venter: First bactierial genomes sequenced
- 1996 First eukaryotic genome-yeast-sequenced
John Craig Venter
1997 -
- 1997 E. Coli sequenced
- 1998 Complete sequence of the C.elegans genome
- 1999 First human chromosome (number 22) sequenced
- 2001 International Human Genome Sequencing: first draft
- April 2003 Human Genome Project Completed. Mouse
genome sequenced.
- April 2004 Rat genome sequenced.
SLIDE 61 What are some Limitations of Mathematical Models
- Not necessarily a ‗correct‘ model
- Unrealistic models may fit data very well leading to erroneous
conclusions
- Simple models are easy to manage, but complexity is often required
- Realistic simulations are difficult and require more time to obtain
parameters
- Models are not explanations and can never alone provide a
complete solution to a biological problem.
SLIDE 62 What We do………………………..
Saikat Chowdhury (JRF)
[Physics; Bioinformatics]
Abhishek Subramanian (JRF)
[Zoology, Bioinformatics]
Noopur Sinha (Project Fellow)
[Bioinformatics & Biotechnology]
Our Team
Vidhi Singh (Project Fellow)
[Mathematics; Computer Sc.]
Rupa Bhowmick (Project Assisstant)
[Bioinformatics and Biophysics]
Piyali Ganguli (Project Assisstant)
[Bioinformatics and Biophysics]
Sutanu Nandi (JRF)
[Computer Sc.]
SLIDE 63 Chemistry Biology Mathematics and Computation
Application of Mathematical, Computational and Optimization methods and concepts in Biochemical sciences
Major Areas of Research
Infectious Diseases / Cancer Biology Biochemical Pathways Gene Circuits Cells Population Systems Biology
PLoS ONE (2008)
- J. Math. Biol. (2011)
- Math. Biosciences (2005)
BioSystems (2008) PLoS NTD (2011) Malaria Journal (2011)- 2 PLoS ONE (2009)
BioSystems (2007, 2005, 2003)
Math Comp Mod (2005) J of Biol Systems (2005) Ecol Modelling - 5 papers J.Math.Appl.Med.Biol. (2002) J .Theor Biol (2001,2002, 2003)
- Proc. Indian Natl.Sc. Acad. (2008)
Biological systems across different levels / scales
PLoS ONE (2013)
In-Silico Model Development Hypotheses Generation Experimental Data Model Validation
Approaches:
- Graph; Boolean
- ODE, SDE, FBA
- Data-based Statistical
Modelling
SLIDE 64 Stimulus Receptor Secondary Messengers Cellular Response
Intra cellular networks - Modeling of Intra-cellular Signaling and Metabolic Processes Identification of potential drug targets, immuno- stimulators and easily targetable molecules
- that can control Cancer cell progression
Study of Tumour Growth Pattern
SLIDE 65 Mathematical Modelling and Forecasting of Malaria Incidence
TMC = 6995.79 – 1087.87T + 4.03R – 1.44TMC-1+ 516.88(T-1) + 40.03T2 – 1.9´10-4R2 – 2.1´10-4(TMC-1)2 + 6.08(T-1)2 + 5.68´10-2T R – 5.64´10-2 TMC-1T – 35.24TT-1 – 2.6´10-04 TMC-1 R
+ 1.67´10-1TMC-1 T-1.
Effects of Rainfall, Temperature & Humidity Mathematical Modelling and Forecasting of Leishmania Incidence (Kala-Azar)
SLIDE 66 THANK YOU
Mosquitoes don’t know maths… So Human intervention is needed for control… Acknowledgement
Council for Scientific and Industrial Research (CSIR) Department of Biotechnology, Govt. of India Department of Science and Technology, Govt. of India
Maths can be a real TRANSFORMER…… ….Fighting against Diseases