
SLIDE 1
7/7/2010 1
FCPF/PC 6 Guyana 29 June 2010
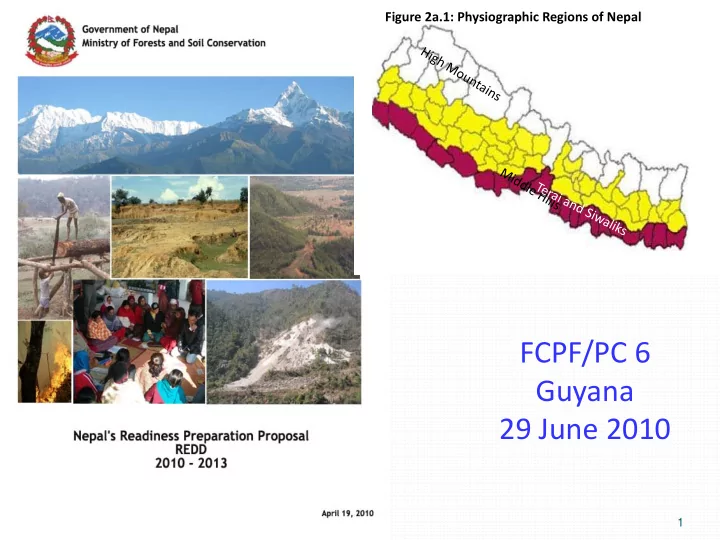
Figure 2a.1: Physiographic Regions of Nepal
FCPF/PC 6 Guyana 29 June 2010 7/7/2010 1 Vision By 2013 and - - PowerPoint PPT Presentation
Figure 2a.1: Physiographic Regions of Nepal FCPF/PC 6 Guyana 29 June 2010 7/7/2010 1 Vision By 2013 and beyond, our greenhouse gas emissions resulting from deforestation and forest degradation, will be significantly reduced by forest
7/7/2010 1
Figure 2a.1: Physiographic Regions of Nepal
7/7/2010 2
7/7/2010 3
7/7/2010 4
7/7/2010 5
7/7/2010 6
7/7/2010 7
7/7/2010 8
21 7 40 14 18
Fig 1: Land Use Type and Coverage in Percentage (National Forest Inventory 1999)
Agriculture land Public Land Forests and shrub land Grass land Rocks and snow cover 7/7/2010 9
7/7/2010 10
7/7/2010 11
Underlying causes of DD and strategic options were
Further analysis steps include:
Technical)
7/7/2010 12
Establish link between carbon ownership and land tenure Utilize existing institutions Build on successful benefit sharing Utilize multi-stakeholders mechanism Fund Transaction - Trust Fund Model. Clearing house Learning from ongoing pilots Higher benefits to locals
7/7/2010 13
Stakeholder Analysis Initial social and environmental situation Analysis of possible impacts of ‘no REDD process’ Analysis of the possible impacts of "REDD Process” Analysis of recommended alternative impacts Verification of compliance with WB policies
7/7/2010 14
Which line represents the historic trend? LRMP FRA
7/7/2010 16
1 9 6 0 1 9 7 0 1 9 8 0 1 9 9 0 2 0 0 0 2 0 1 0 2 0 2 0 2 0 3 0 biom ass
7/7/2010 18
Proposed monitoring, data management and reporting system
Central Forest GeoDatabase (CFGD) FRA 2012
National / Sub-national Administrative, Watershed etc.. Community Forest Private forest Leasehold forest GoN Managed forest Protected area Collaborative forest Religious forest etc..
Benchmark database Boundary Regimes Forest Regime Wall-to-Wall monitoring Validation Imageries RS data Field based data from sample Plots
Reported tabular data
National Forest Information Management System (NAFIMS)
Information Monitor Management/Actor
Option # 1 Option # 2 DFCC
VDC/ VFCC
DDC INGO IPs and local communities Civil Society Donors/ Stakeholders Actors
HDI. Poverty Map National Statistics Food Security, Disaster etc..
Other Data Sources
International
Enablers
Access and share data through web-based Portal
DFO/PAs
Information Governance
7/7/2010 19
Total costs 7,654.5 Government 335.0 FCPF 3,595.4 DFID/ S DC through funds already committed for Nepal National Forest Programme 1,447.5 Government of Finland through funds already committed to FRA proj ect 780.0 JICA (TBC) 360.0 US AID (TBC) 1,136.6
Received on 11 June, 2010
Relation between REDD Forum and REDD-Cell, Role of National Planning Commission, Indigenous population, Consultations across the different regions ( in 1b),
7/7/2010 28
7/7/2010 29