f armland l easing
play

F ARMLAND L EASING A RRANGEMENTS AND L AND V ALUES Melissa ORourke - PDF document

8/1/2016 F ARMLAND L EASING A RRANGEMENTS AND L AND V ALUES Melissa ORourke B.S., M.A., J.D. F ARM & A GRIBUSINESS M ANAGEMENT S PECIALIST Housed at ISU Extension Winneshiek County in Decorah www.extension.iastate.edu/agdm


  1. 8/1/2016 F ARMLAND L EASING A RRANGEMENTS AND L AND V ALUES Melissa O’Rourke B.S., M.A., J.D. F ARM & A GRIBUSINESS M ANAGEMENT S PECIALIST Housed at ISU Extension — Winneshiek County in Decorah www.extension.iastate.edu/agdm morourke@iastate.edu 563-382-2949 
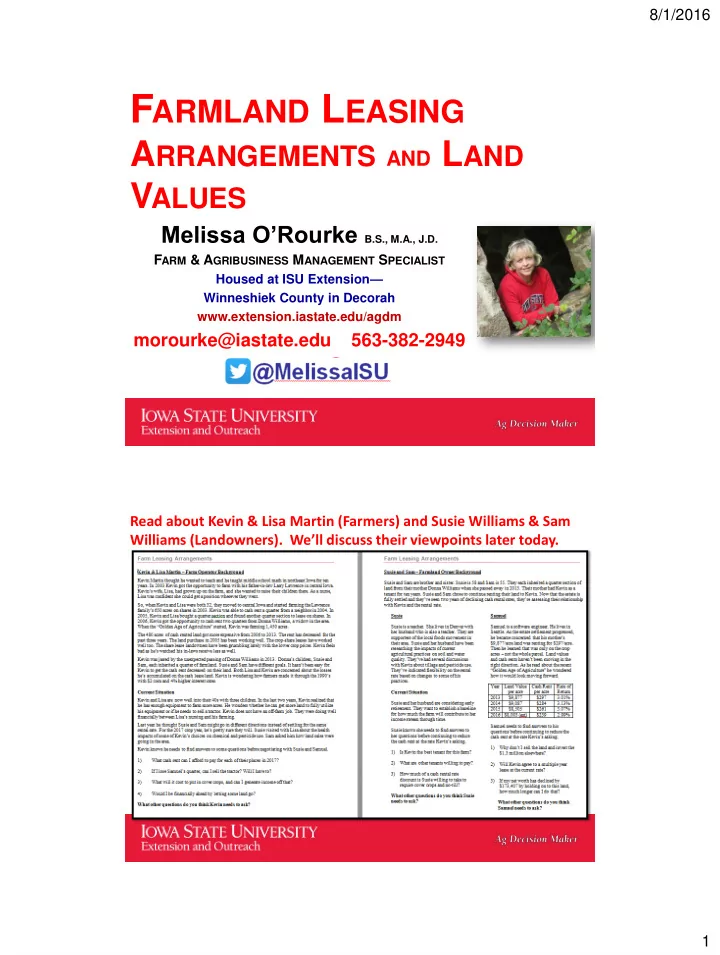
Read about Kevin & Lisa Martin (Farmers) and Susie Williams & Sam Williams (Landowners). We’ll discuss their viewpoints later today. 1

  2. 8/1/2016 IS ISU U Extension Extension Far arm m Mana Management gement Team eam Key Topics Today: ► Trends in . . . – Farm land values – Cash rental rates ► Costs of crop production -- resources ► Negotiating a fair cash lease rate ► 2017 Farm Leasing Considerations: – Communications – Legal issues – . . . And much more! 2

  3. 8/1/2016 The Goal? • You leave here today with increased knowledge and confidence to assist you to - - – Review current leasing arrangements . . . – Take steps to plan for the future . . . and – Know where to go for resources and assistance. ww www.e .exte tensi sion.i .iast state.e .edu/a /agdm Get familiar with Ag Decision Maker!! 3

  4. 8/1/2016 4

  5. 8/1/2016 Examp Example: le: Calcu Calcula lating ting Cash Cash Ren ent t Tax ax Cr Cred edit it • 160 acres cash rented • $300 per acre • $48,000 gross lease income • $48,000 x 7% = $3360 Iowa income tax credit • Can be used for flexible & crop-share leases too. 5

  6. 8/1/2016 For Mor or More Inf e Infor orma mati tion on and and to to App pply: y: • See 3-page application at: • IowaFinanceAuthority.gov • Beginning farmer’s financial statement • Beginning farmer’s background letter • Fees = start at $300 and depend on the length of the lease 6

  7. 8/1/2016 You Answered — We Listened: Which of the following would you consider to be your PRIMARY occupation? Answer Response % Non-farming landowner 144 44% Active farmer 97 29% Ag lender 24 7% Attorney or Accountant 8 2% Professional farm manager 3 1% Other (please specify) 53 16% Total 329 100% Apply for the Intended Changes Beginning to Lease Farmer Tax File and Arrangements: Credit or perfect a Custom landlord's lien Farming Tax 3% Increase rent Credit 3% 4% Move from an oral lease to a written lease Decrease rent agreement 30% 9% Other Change type of 9% lease No changes 9% will be made 24% N=382 excludes Not Lessors/Not Lessees 7

  8. 8/1/2016 You answered, we listened: Why do you participate in farmland leasing meetings? 1. Gain knowledge on farmland leasing, rental market and trends 2. Improve knowledge for communicating with other parties involved 3. Gain knowledge on leasing practices You answered, we listened: What topics would you want covered at the 2016 Farmland Leasing Meeting? 1. Setting rates and determining what is fair 2. Costs of production, profitability 3. Taking care of the land 4. Types of leases 5. Legal updates – negotiations, terminations 8

  9. 8/1/2016 Thinking About Farmland Leasing from Two Different Perspectives -Meet Kevin & Lisa Martin -and- Susie Williams & Sam Williams • Take 5 minutes to read through the cases. • Take another 5-10 minutes to visit about the cases with others. • These folks will be with us for the rest of the program. Susie – and – Sam Williams Kevin & Lisa Martin  Different Perspectives • What additional questions do you have now as the Martins, or the Williams siblings? • Consider how each party in the farmland leasing arrangement thinks differently about how the other party interprets and uses information. • What if Sue & Sam decided they wanted to consider a new tenant for 2017 – what questions should they ask of the potential tenant(s)? 9

  10. 8/1/2016 Why is it important for Kevin & Lisa Martin and Susie Williams and Sam Williams to think about farmland values? What are some sources of Iowa Farmland Value Data? 10

  11. 8/1/2016 County Assessors’ Offices • Some county assessors maintain a public (pdf) document of ag land sales – for example: • http://siouxcounty.org/wp-content/uploads/2016/05/agsales.pdf Most county assessor offices in Iowa offer a search tool to find information about real estate ownership, values and sales within the county. 11

  12. 8/1/2016 Realty & Auction Websites Federal Reserve Bank — Chicago • www.chicagofed.org – Quarterly survey of ag lenders by state – Annual Land Values Conference – AgLetter: Quarterly Newsletter re: ag land values & credit – Go to chicagofed.org and click on publications 12

  13. 8/1/2016 Agricul ultur tural land nd values ues in the Seventh Federal Reserve District fell 4 percent nt from a year ago in the first quarter of 2016 — their largest year-over-year decline since the third quarter of 2009. There was a decrease of 1 percent in “good” farmland values in the first quarter of 2016 relative to the fourth quarter of 2015, based on the survey responses of 200 District agricultural bankers. Cash sh rent ntal rate tes s for Distr strict t farmland nd exper perienc nced d a signific nificant nt drop p of 10 percent t for 2016 compa pared with h 2015 — even n larger ger than n the decrease se of last st year relative to 2014. Demand to purchase agricultural land was markedly lower in the three- to six-month period ending with March 2016 compared with the same period ending with March 2015. Moreover, the amount of farmland for sale, the number of farms sold, and the amount of acreage sold were all down during the winter and early spring of 2016 compared with a year ago. Nearly two-thirds of the responding bankers expected farmland values to decrease during the second quarter of 2016, with the rest expecting farmland values to remain stable. AgLetter Federal Reserve Bank of Chicago 13

  14. 8/1/2016 Realtors Land Institute – See your book – at page 35 – Semi-annual survey (March and September) – Compares land classification by corn production – Most recent survey always available on Ag Decision Maker – www.extension.iastate.edu/agdm 14

  15. 8/1/2016 - Dollars per acre and percent change from 2014 http://usda.mannlib.cornell.edu/usda/current/AgriLandVa/AgriLandVa-08-05-2015.p “The Iowa farmland market is showing weakness following significant increases in value over the past decade. Based on the Iowa State University Farmland Value Survey, 2015 Iowa land values have decreased two years in a row since 2000. However, despite these decreases , current Iowa farmland values are still more than double what they were 10 years ago, 75 percent higher than the 2009 values and 14 percent .” 15

  16. 8/1/2016 Value in each year of $1,000 invested in 1950 in Iowa farmland or the S&P Iowa State University Farmland Value Survey – Conducted annually since 1941 – Mailed to 1100 licensed real estate brokers; 500-600 responses – Released annually in mid-December – November 1 to November 1 – Latest and historical surveys found on Ag Decision Maker website – www.extension.iastate.edu/agdm SEE YOUR BOOK – page 27 16

  17. 8/1/2016 Iowa Farmland Value Portal http://card.iastate.edu/farmland Farmland Value per Acre 1950-2015 Land value per acre ($/acre) 8000 6000 4000 2000 0 17

  18. 8/1/2016 Farmland Values for Crop Reporting District 3 by Year $12,000 High Medium Low $11,000 $10,000 $9,000 $8,000 $ per acre $7,000 $6,000 $5,000 $4,000 $3,000 ↓ $1,300 $2,000 ↓ 14% $1,000 $0 2006 2007 2008 2009 2010 2011 2012 2013 2014 2015 Iowa Farmland Purchases by Farmers and Investors and Land Values 2006-2015 Farmers Investors Average Land Value 90% $10,000 $9,000 80% Average Land Value per Acre $8,000 70% Percent of Sales $7,000 60% $6,000 50% $5,000 40% $4,000 30% $3,000 20% $2,000 10% $1,000 0% $0 18

  19. 8/1/2016 Northeast counties – 2014 & 2015 farmland values Percent Change – 2014 to 2015 19

  20. 8/1/2016 Crop Reporting District 3  Crop Reporting  District 2 Farmland Values Predictions in Five Years Increase Decrease 5% or Increase Stay the Decrease Decrease 10% or District more 0-5% same 0-5% 5-10% more PERCENT 16 18 20 16 16 14 Northwest 16 12 10 17 22 22 North Central 7 22 15 10 22 24 Northeast 20 20 16 14 16 12 West Central 22 21 19 8 19 11 Central 9 19 17 19 19 19 East Central Southwest 18 15 21 10 13 23 12 12 15 12 32 18 South Central 6 14 26 14 17 23 Southeast 14 17 17 14 19 18 STATE 20

Download Presentation
Download Policy: The content available on the website is offered to you 'AS IS' for your personal information and use only. It cannot be commercialized, licensed, or distributed on other websites without prior consent from the author. To download a presentation, simply click this link. If you encounter any difficulties during the download process, it's possible that the publisher has removed the file from their server.

Recommend


More recommend