Key Topics Today: Team eam Trends in . . . Farm land values Cash - - PDF document

key topics today
SMART_READER_LITE
LIVE PREVIEW

Key Topics Today: Team eam Trends in . . . Farm land values Cash - - PDF document

8/1/2016 F ARMLAND L EASING Read about Kevin & Lisa Martin (Farmers) and Susie Williams & Sam Williams (Landowners). Well discuss their viewpoints later today. A RRANGEMENTS AND L AND V ALUES Melissa ORourke B.S., M.A., J.D. F ARM


slide-1
SLIDE 1

8/1/2016 1

FARMLAND LEASING

ARRANGEMENTS AND LAND VALUES

Melissa O’Rourke B.S., M.A., J.D.

FARM & AGRIBUSINESS MANAGEMENT SPECIALIST Housed at ISU Extension— Winneshiek County in Decorah www.extension.iastate.edu/agdm

morourke@iastate.edu 563-382-2949

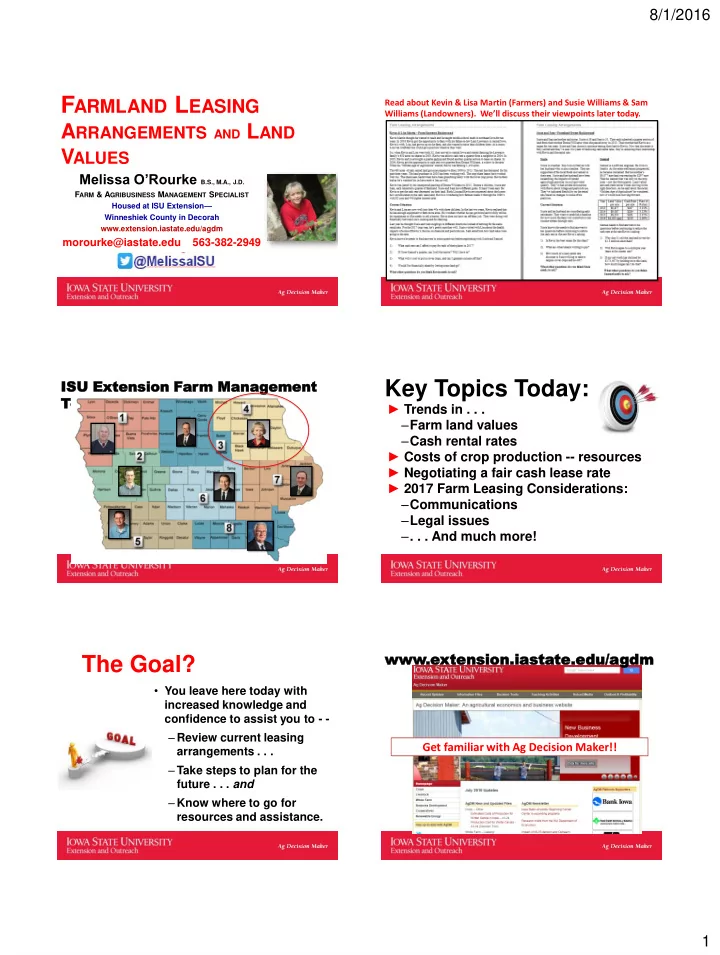
Read about Kevin & Lisa Martin (Farmers) and Susie Williams & Sam Williams (Landowners). We’ll discuss their viewpoints later today.

ISU ISU Extension Extension Far arm m Mana Management gement Team eam

Key Topics Today:

► Trends in . . . –Farm land values –Cash rental rates ► Costs of crop production -- resources ► Negotiating a fair cash lease rate ► 2017 Farm Leasing Considerations: –Communications –Legal issues –. . . And much more!

The Goal?

  • You leave here today with

increased knowledge and confidence to assist you to - - – Review current leasing arrangements . . . – Take steps to plan for the future . . . and – Know where to go for resources and assistance.

www.exte tensi sion.iasta state te.edu/a /agdm

Get familiar with Ag Decision Maker!!

slide-2
SLIDE 2

8/1/2016 2 Example: xample: Calcula Calculating ting Cas Cash h Rent ent Tax ax Cr Credit edit

  • 160 acres cash rented
  • $300 per acre
  • $48,000 gross lease

income

  • $48,000 x 7% = $3360

Iowa income tax credit

  • Can be used for flexible

& crop-share leases too.

For

  • r Mor

More Inf e Infor

  • rma

mation ion and and to

  • Appl

pply: y:

  • See 3-page application at:
  • IowaFinanceAuthority.gov
  • Beginning farmer’s

financial statement

  • Beginning farmer’s

background letter

  • Fees = start at $300 and

depend on the length of the lease

slide-3
SLIDE 3

8/1/2016 3

You Answered—We Listened: Which

  • f the following would you consider

to be your PRIMARY occupation?

Answer Response % Non-farming landowner 144 44% Active farmer 97 29% Ag lender 24 7% Attorney or Accountant 8 2% Professional farm manager 3 1% Other (please specify) 53 16% Total 329 100% N=382 excludes Not Lessors/Not Lessees

Decrease rent 30% No changes will be made 24% Change type of lease 9% Other 9% Move from an

  • ral lease to a

written lease agreement 9% Apply for the Beginning Farmer Tax Credit or Custom Farming Tax Credit 4% File and perfect a landlord's lien 3% Increase rent 3%

Intended Changes to Lease Arrangements:

You answered, we listened:

Why do you participate in farmland leasing meetings?

  • 1. Gain knowledge on farmland

leasing, rental market and trends

  • 2. Improve knowledge for

communicating with other parties involved

  • 3. Gain knowledge on leasing

practices

You answered, we listened:

What topics would you want covered at the 2016 Farmland Leasing Meeting?

  • 1. Setting rates and

determining what is fair

  • 2. Costs of production,

profitability

  • 3. Taking care of the land
  • 4. Types of leases
  • 5. Legal updates –

negotiations, terminations

Thinking About Farmland Leasing from Two Different Perspectives

  • Meet Kevin & Lisa Martin -and-

Susie Williams & Sam Williams

  • Take 5 minutes to read through the cases.
  • Take another 5-10 minutes to visit about the

cases with others.

  • These folks will be with us for the rest of the

program.

Kevin & Lisa Martin  Susie –and– Sam Williams

Different Perspectives

  • What additional questions do you have now as

the Martins, or the Williams siblings?

  • Consider how each party in the farmland leasing

arrangement thinks differently about how the

  • ther party interprets and uses information.
  • What if Sue & Sam decided they wanted to

consider a new tenant for 2017 – what questions should they ask of the potential tenant(s)?

slide-4
SLIDE 4

8/1/2016 4

What are some sources of Iowa Farmland Value Data?

Why is it important for Kevin & Lisa Martin and Susie Williams and Sam Williams to think about farmland values?

County Assessors’ Offices

  • Some county assessors maintain a public (pdf)

document of ag land sales – for example:

  • http://siouxcounty.org/wp-content/uploads/2016/05/agsales.pdf

Most county assessor offices in Iowa offer a search tool to find information about real estate ownership, values and sales within the county.

Realty & Auction Websites

Federal Reserve Bank—Chicago

  • www.chicagofed.org

– Quarterly survey of ag lenders by state – Annual Land Values Conference – AgLetter: Quarterly Newsletter re: ag land values & credit – Go to chicagofed.org and click on publications

slide-5
SLIDE 5

8/1/2016 5

Agricultura ral land values in the Seventh Federal Reserve District fell 4 percent nt from a year ago in the first quarter of 2016—their largest year-over-year decline since the third quarter of 2009. There was a decrease of 1 percent in “good” farmland values in the first quarter of 2016 relative to the fourth quarter of 2015, based on the survey responses of 200 District agricultural bankers. Cash rental rates for r Distri rict farmland nd experienc nced a s signi nificant nt drop of 10 percent for r 2016 compare red with 2015—even n larger r than the decrease of last year relative to 2014. Demand to purchase agricultural land was markedly lower in the three- to six-month period ending with March 2016 compared with the same period ending with March 2015. Moreover, the amount of farmland for sale, the number of farms sold, and the amount of acreage sold were all down during the winter and early spring of 2016 compared with a year ago. Nearly two-thirds of the responding bankers expected farmland values to decrease during the second quarter of 2016, with the rest expecting farmland values to remain stable.

AgLetter

Federal Reserve Bank of Chicago

Realtors Land Institute

–See your book – at page 35

–Semi-annual survey (March and September) –Compares land classification by corn production –Most recent survey always available on Ag Decision Maker –www.extension.iastate.edu/agdm

http://usda.mannlib.cornell.edu/usda/current/AgriLandVa/AgriLandVa-08-05-2015.p

  • Dollars per acre

and percent change from 2014

“The Iowa farmland market is showing weakness following significant increases in value over the past decade. Based on the Iowa State University Farmland Value Survey, 2015 Iowa land values have decreased two years in a row since 2000. However, despite these decreases, current Iowa farmland values are still more than double what they were 10 years ago, 75 percent higher than the 2009 values and 14 percent .”

slide-6
SLIDE 6

8/1/2016 6

Value in each year of $1,000 invested in 1950 in Iowa farmland or the S&P

Iowa State University Farmland Value Survey

– Conducted annually since 1941 – Mailed to 1100 licensed real estate brokers; 500-600 responses – Released annually in mid-December – November 1 to November 1 – Latest and historical surveys found on Ag Decision Maker website – www.extension.iastate.edu/agdm

SEE YOUR BOOK – page 27

Iowa Farmland Value Portal

http://card.iastate.edu/farmland

Farmland Value per Acre 1950-2015

2000 4000 6000 8000 Land value per acre ($/acre) $0 $1,000 $2,000 $3,000 $4,000 $5,000 $6,000 $7,000 $8,000 $9,000 $10,000 $11,000 $12,000 2006 2007 2008 2009 2010 2011 2012 2013 2014 2015 $ per acre High Medium Low

Farmland Values for Crop Reporting District 3 by Year

↓$1,300 ↓14%

Iowa Farmland Purchases by Farmers and Investors and Land Values 2006-2015

$0 $1,000 $2,000 $3,000 $4,000 $5,000 $6,000 $7,000 $8,000 $9,000 $10,000 0% 10% 20% 30% 40% 50% 60% 70% 80% 90% Average Land Value per Acre Percent of Sales Farmers Investors Average Land Value

slide-7
SLIDE 7

8/1/2016 7 Northeast counties – 2014 & 2015 farmland values Percent Change – 2014 to 2015

Crop Reporting District 3  Crop Reporting  District 2

Farmland Values Predictions in Five Years

District Increase 5% or more Increase 0-5% Stay the same Decrease 0-5% Decrease 5-10% Decrease 10% or more PERCENT Northwest

16 18 20 16 16 14

North Central

16 12 10 17 22 22

Northeast

7 22 15 10 22 24

West Central

20 20 16 14 16 12

Central

22 21 19 8 19 11

East Central

9 19 17 19 19 19

Southwest

18 15 21 10 13 23

South Central

12 12 15 12 32 18

Southeast

6 14 26 14 17 23

STATE

14 17 17 14 19 18

SUMMARY: Land Value Survey

  • Farmland values hit a historic peak of $8,716 per acre in 2013, but

declined 8.9% to $7,943 the following year.

  • Drop in value in 2015 is smaller than 2014; but marks the third time

values have fallen since 2009.

  • The 3.9% percent decline may seem less than what many people

speculated, but this is not out of line due to a mix of factors, including a lot of cash in hand for many farmers, market expectation of this decline early on, robust livestock returns, and strong recreational demand.

  • Despite decreasing again, farmland values are still more than 2X the

reported values from 10 years ago, and almost 14 % higher than 2011 values.

  • Farm income & interest rates are key to watch
  • For more info visit www.card.iastate.edu
  • Impacts for Kevin & Lisa Martin?
  • For Susie Williams and Sam Williams?

Landlord-Tenant Communication: It’s a 2-way street

  • Farmland owners need to be
  • pen to learning about current

farming challenges, conditions, costs of productions

  • Producers need to listen to the interests and goals
  • f farmland owners; and be willing to share

information about inputs, yields, and crop plans

slide-8
SLIDE 8

8/1/2016 8 Communica Communication tion Methods ethods:

  • Newsletter
  • E-mail
  • Facebook, Twitter, blog
  • Phone calls
  • Stop by for a cup of coffee
  • Annual or periodic meetings
  • KEY: Don’t limit

communication to annual rent payment and rent negotiations.

  • More farmland owners

require written annual report as a lease condition.

  • Owner agrees: Information

provided by the Tenant (such as yields, management practices) is kept confidential.

  • Proprietary business

information needs to be shared to negotiate lease terms – but it is not to be shared in the “coffee shop.”

Winning Communication Strategies:

  • Communicate regularly, not

just once a year

  • Producers: Take time to

share and educate Owners about current trends in agriculture, farm costs

  • Provide regular crop reports

during growing season

  • Maintain farm appearance
  • Treat landowners like family

– with respect and kindness.

Communication-Negotiation Process Tips:

  • Start early, use data –
  • Base conversations on facts
  • Producers: Know your costs,
  • overhead, breakeven points
  • Producers: Understand challenges landowners face

with declining revenues

  • Producers: Share information on yields, prices,

records, satellite photos, fertility records, government payments, crop insurance

  • Landowners: Know your costs, know what you need
  • Landowners: Learn about production costs

Communication Setbacks?

  • Ask for more time
  • Be aware of your non-verbal communication
  • Focus on what the other person is saying and

what they really mean

  • Request more information to clarify points.
  • Ask if other party has areas of compromise or

negotiation.

  • Stick to building trust, use tact and logic
  • Try to understand the other party’s perspective

– “new truck”

  • Use a third-party to help mediate, guide

discussion

Far arm m Leas Lease e Bas Basics ics: : A A Few ew Pointer

  • inters
  • Strong preference for

written leases – See your book – page 94 (short form)

  • Legal issues, including

lease termination

  • Communication

fundamentals

slide-9
SLIDE 9

8/1/2016 9

Why y sh should a farm m lease se be written?

  • Provides more assurance

that the parties understand

  • ne another.
  • Lease of more than 1 year

must be in writing to be enforceable.

  • Lease of 5 years or more

must be in writing and recorded at the county recorder’s office.

Shouldn’t a handshake be good enough? • Don’t rely on selective

memory.

  • Be sure that you cover all

the provisions that you intend to cover.

  • Define meaning of terms.
  • Put things in writing

because you value the relationship . . . and because you don’t want there to be later misunderstandings!

A A Few ew Exa Examples mples . . . . . . .

  • Fencing
  • Hunting rights
  • Crop residue

(stover) As Assuri uring ng the he Ren ent is is Paid aid

  • How can parties

assure one another that the rent will be paid?

First st Step tep? ? --

  • - Use

se a wr writt tten lease se.

And, be sure that: (1) The legal description and parcel number in the lease is accurate. (2) The parties to the lease are properly identified. (3) The lease terms are clear.

Ad Additional ditional tools tools to to as assur ure e rent ent pay payment ment may may inc include: lude:

  • Require all rent paid on March 1.

(Reduction for interest paid by the borrower may be a consideration.)

  • Require irrevocable letter of credit

from the Producer/Tenant’s lender.

  • Require Landlord’s name be included

as Payee on checks for crops.

  • File and perfect a Landlord Lien – this

includes recording the lease – seek professional legal assistance for this.

slide-10
SLIDE 10

8/1/2016 10

Far arm m Lease Lease Ter ermina mination: tion: Does

s lease se termi mination me mean the end of the Owner–Tenant relationsh ship?

  • Not necessarily – but it means

either the Owner (or the Tenant) want to make some changes for the next year.

  • See your book – page 97

 Without written notice of termination, lease automatically renews under the same terms and conditions for the following crop year.

Farm Lease Termination:

  • Iowa Code 562.6: Amended in 2016 to clarify that whether

the lease is oral or written, the termination notice must be in writing!

  • Notice cannot be contained within the lease – it must be a

separate written notice.

  • Serve written notice on or before September 1 (this

terminates the current least on the following March 1).

  • Serve in person (have them sign the notice and keep a

copy); or by Certified US Mail (keep copy of receipt, return receipt optional); or by publication if neither in-person or mail can be accomplished.

Turn to to page 37 in your r book

  • We’ll look at the 2016

Cash Rental Rate survey – and walk through some calculations and ways to think about how to arrive at a number that is fair to both the Owner and the Producer.

  • When you have time,

read through this page that explains the survey methodology and information.

Average/Typical Cash Rents for Corn & Soybean Acres – p 38

We’re focusing on counties in Crop Reporting Districts 2 or 3 State and Crop Reporting District Average Rent by Year

$144 $157 $190 $186 $192 $223 $266 $281 $277 $273 $100 $150 $200 $250 $300 2006 2007 2008 2009 2010 2011 2012 2013 2014 2015 State District 3

slide-11
SLIDE 11

8/1/2016 11

Projected 2016 ARC-CO Payments

Corn

*Payments based on yield and price projections as of 7/13/2016

Marshall Benton Clay Shelby Clayton Jackson Hamilton Taylor Muscatine Wright Clinton Iowa Buena Vista Woodbury Kossuth Worth Washington Sac Humboldt Cherokee Winnebago Lyon Marion Keokuk Johnson Monroe O'Brien Dubuque Van Buren Franklin Guthrie Jefferson Floyd Appanoose Davis Clarke Black Hawk Scott Plymouth Mitchell Dallas Palo Alto Fremont Ringgold Butler Montgomery Warren Decatur Webster Calhoun Mahaska Boone Linn Jasper Page Ida Crawford Adams Cedar Carroll Audubon Delaware Hardin Sioux Adair Union Mills Wayne Monona Harrison Lucas Polk Buchanan Chickasaw Des Moines Cass Allamakee Madison Cerro Gordo Fayette Bremer Tama Osceola Henry Poweshiek Hancock Winneshiek Jones Pocahontas Greene Louisa Wapello Lee Story Grundy Pottawattamie Howard Dickinson Emmet

$70 $67 $61 $73 $72 $53 $13 $63 $27 $74 $32 $41 $12 $62 $36 $0 $25 $27 $46 $35 $72 $1 $0 $70 $76 $71 $0 $46 $14 $0 $54 $0 $15 $0 $49 $40 $72 $35 $37 $64 $25 $0 $73 $30 $0 $0 $37 $30 $13 $48 $72 $11 $57 $72 $55 $49 $73 $35 $52 $72 $57 $64 $26 $0 $67 $42 $0 $20 $60 $37 $45 $29 $67 $16 $36 $71 $34 $60 $60 $0 $23 $52 $72 $71 $34 $42 $48 $6 $32 $48 $75 $0 $39 $25 $21 2016 Corn ARC-CO Payment $50 - $76 $25 - $50 $1 - $25 $0 - $1 No Data

Projected 2016 ARC-CO Payments

Soybeans

*Payments based on yield and price projections as of 7/11/2016

Projected 2016 ARC-CO Payments

Crop Reporting District 3

$/Base Acre

Corn Payment Soybeans Payment *Payments based on yield and price projections as of 7/13/2016 www.extension.iastate.edu/agdm/crops/xls/a1-33farmbilldata.xlsx

What is the Iowa Nutrient Reduction Strategy?

  • Voluntary, science-based program to

reduce Nitrogen and Phosphorous impact

  • n water
  • Includes cities, industry and agriculture
  • A practice-based approach to show

meaningful and measureable progress

  • A framework for innovation and verification
  • f new practices and technologies

Financial Impact?

If cover crops result in a decreased level

  • f profitability, will the Landowner

decrease the cash rental rate to provide an incentive to the Producer-Tenant to adopt the strategy?

$-50 $-40 $-30 $20 $-10 $0 $10 $20

slide-12
SLIDE 12

8/1/2016 12 Questions to ask producers:

  • Are you raising cover

crops?

– Yes –

  • How many acres?
  • Why?
  • Does it work financially?
  • What’s happening with

your production (yields, weed pressure, burn down, differences from year to year)?

  • Are there social

pressures?

What is cost of production? It is the sum of costs related to making

  • r producing a product.
  • Land
  • Crop Inputs
  • Machinery
  • Labor
  • Page 78 – starting point for cost of

production data.

ISU Estimated Costs of Production

Released late December or early January each year Numbers from several sources:

 Iowa Farm Business Association  ISU Department of Agriculture and Land Stewardship  Survey of input suppliers around Iowa

 Often used as a gauge for planning purposes by ag businesses and financial institutions  Page 78 in your book . . .

Looking ahead…

  • Preliminary numbers indicate another year of

economic losses.

  • Economic losses are not necessarily cash

losses.

  • Cash Outlay – Expenses

– Operating costs, variable machinery costs, hired labor – Land costs if the land is cash rented, or in the process

  • f being purchased

Corn following Soybeans

Preharvest machinery , $36.90 Seed, chemicals, etc., $292.46 Harvest machinery, $89.85 Labor, $33.80 Land, $266.00

Soybeans following Corn

[CATEGORY NAME], [VALUE] Seed, chemicals, etc., $162.63 Harvest machinery, $36.95 Labor, $29.25 Land, $266.00

slide-13
SLIDE 13

8/1/2016 13

Fixed Cash Lease – Determining a “Fair” Rental Rate

http://www.card.iastate.edu/ag_risk_tools/cash-rental-rates/

Interactive Decision Tool

Computing a Cropland Cash Rental Rate – see page 65

  • We’ll walk through calculations

for 4 different bases for cash rent calculations:

  • 1. What others are charging
  • 2. Average rent for production

(yields)

  • 3. Average rent for CSR
  • 4. Return on Value

– Other flexible methods

Do Your Farmland Fact Finding

  • 1. Land value estimate for tillable acres ($/acre)
  • 2. Number of Tillable Acres (If you don’t know, check

county USDA FSA Office: Form 578 completed annually)

  • 3. Corn Suitability Rating? (CSR/CSR2) (See

County Assessor's Office or NRCS Soil Survey)

  • 4. Special features? Drainage issues, irregular

field shapes (See tile, terrace maps, aerial photos)

  • 5. Most recent 5-Year Actual/Average Yields on

that farm (Corn & Soybeans).

Source: Johnson, ISU Extension, May 2011

Method #1: What’s the “going” rate?

  • Rumors often inaccurate.
  • Compare to many others,

not just one

  • Remember, seemingly

small differences in land quality can make a big difference in appropriate rents.

Location: Winneshiek County Tillable Acres in parcel: 75 Acres Corn Yield: 167 bu/Acre Soybean Yield: 45 bu/Acre These are the yields on that farm/parcel – ideally, a 5-year rolling average. Corn Suitability Rating: 82 CSR2

Let’s take an Example . . . a fictional parcel in Winneshiek County:

slide-14
SLIDE 14

8/1/2016 14

►Start at page 37, then go to appropriate District page (1, 2, 3 etc) ►Example parcel in Winneshiek–page 41 ►Determine Overall as well as High, Middle, Low averages for county ►Determine where your parcel fits ►Select an appropriate figure from the survey information ►Note on “Example” parcel – CSR2 is high, but yields a little below average.

Method #1: Typical Cash Rent

p 41

Method #1: Typical Cash Rent

. . . continued . . . .

  • “Example” parcel – CSR2 (82) is higher than

county average (78); but yields (167 & 45) are a little lower than county average (174-corn; 50-beans).

  • Winneshiek County “high quality” rent is

$286, medium quality rent is $245.

  • Average ($286 + $245) /2 = $265.60
  • We’ll use $266 as a “typical” rent for this

parcel, based on the ISU survey.

Method #2: Average Rents per Yield (corn & beans)

  • Corn Yield calculation
  • Parcel’s average corn yield = 167 bu/A
  • Times rent per bushel of Corn yield

$ 1.40

  • Average Rent for Corn Acres:

$ 233.80

– 167 X $1.40 = $233.80

  • Soybean Yield calculation
  • Parcel’s average bean yield = 45 bu/A
  • Times rent per bushel of bean yield

$ 4.86

  • Average Rent for Bean Acres:

$ 218.70

– 45 X $4.86 = $218.70

Method #2: Average the corn & bean calculations 

  • Average Rent for Corn Acres:

$ 233.80

  • Average Rent for Bean Acres:

$ 218.70

  • ($233.80 + $218.70) / 2 = $226.25 ($226)
  • Average Rent, Corn & Soybean Acres: $226

Method #3: Corn Suitability Rating calculation

  • Corn Suitability Rating calculation
  • Parcel’s CSR2 = 82
  • Times rent per CSR index point $ 3.12
  • Average Rent for Corn Acres:

$ 255.84

– 82 CSR X $3.12/CSR point = $255.84 ($256)

– Rent based on CSR2 only = $256

slide-15
SLIDE 15

8/1/2016 15 Method #4: Rent based on Return

  • n Value/Investment
  • Market value of

cropland/parcel = $/acre

  • Winneshiek County average:

$7,054 (ISU Survey-Dec 2015)

  • “My” Parcel value = $7,200
  • Desired return on value =

2.75%

  • $7,200 X 2.75% = $198/acre

($198)

Source: ISU Extension Publication FM-1851

Average of all 4 Methods

Method 1: Typical Cash Rent $ 266 Method 2: Average Rent per yield $ 226 Method 3: Average Rent per CSR2 Point $ 256 Method 4: Return on Investment/Value $ 198

Average $236.50 /acre

$236.50 /A X 75 Tillable Acres =$17,737.50 But – we don’t stop here. Consider . . . .

Overall Average Method

See See p37 p37 in in Leasing Leasing book: book:

Ad Additio ditiona nal l Method Methods s of

  • f F

Far armla mland nd Le Lease ase Valu aluation tion ? ? – See See you

  • ur

r bo book

  • k on
  • n pa

page ge 69 69—Fle lexib xible le Far arm m Le Lease ase Ag Agree eeme ments: nts:

  • 5. Gross Income Method
  • 6. Tenant Residual Method
  • 7. Crop Share Method

Crop Share Equivalent Method: See book pages 66-67 for discussion and an example.

Landlord Tenant Land ½ inputs Labor ½ inputs Machinery Management ½ income ½ income

Crop Share 50-50 Lease

Landlord Tenant Land $105 ½ inputs $195 Labor $ 31 ½ inputs $195 Machinery $ 92 Management - $ 18 ½ income $300 ½ income $300 Crop Share Corn Lease 2016 Corn

slide-16
SLIDE 16

8/1/2016 16

Landlord Tenant Land $146 ½ inputs $ 81 Labor $ 27 ½ inputs $ 81 Machinery $ 72 Management $ 47 ½ income $227 ½ income $227 Crop Share 50-50 Lease 2016 Soybean

Other Flexible Cash Rent Examples:

  • File C2-22 on

Ag Decision Maker 

Shar hare e of

  • f G

Gros

  • ss Income

ncome

CORN: (151 bu X $3.97) = $ 599 SOYBEANS: (46 bu X $9.85) = $ 453

Iowa cash rents typically are equal to about 30 to 40 percent of the gross income from producing corn, and 35 to 45 percent of the gross income from producing soybeans.

Cash Rental Rate CORN: $ 599/ ac x 30% = $ 180 SOYBEANS: $ 453/ ac x 40% = $ 181 Average $ 180

Tenant enant Res esidual idual Method ethod

CORN: $ 599- $ 572 = $ 27 SOYBEAN: $ 453 - $ 321 = $ 132 Average: $ 80 Cash Rent Survey Per Bushel Yield Per CSR Point Return on Investment Gross Income Tenant Residual Crop Share Average Corn Soybeans $242 $242 $242 $239 $242 $242 $195 $195 $180 $181 $ 27 $132 $195 $ 81 $188

Other Resources: Inside Back Cover of Your Book

slide-17
SLIDE 17

8/1/2016 17 Thank-you! Please contact ISU Extension

with your Farm Management questions!

Melissa O’Rourke B.S., M.A.,

J.D.

FARM & AGRIBUSINESS MANAGEMENT SPECIALIST

Housed at ISU Extension—Winneshiek County in Decorah

www.extension.iastate.edu/agdm morourke@iastate.edu 563-382-2949