Experimental Reactor Core Flow Mixing Characteristics according to - - PDF document

experimental reactor core flow mixing characteristics
SMART_READER_LITE
LIVE PREVIEW

Experimental Reactor Core Flow Mixing Characteristics according to - - PDF document

Transactions of the Korean Nuclear Society Virtual Spring Meeting July 9-10, 2020 Experimental Reactor Core Flow Mixing Characteristics according to Cold Leg Flow Balance Using a Pipe Core Simulator D.J.Euh a , K.H.Kim a , W.M.Park a ,


slide-1
SLIDE 1

Experimental Reactor Core Flow Mixing Characteristics according to Cold Leg Flow Balance Using a Pipe Core Simulator

D.J.Euh a, K.H.Kim a, W.M.Park a, W.S.Kima, H.S.Choia, H.S. Seola, Y.J.YOUN, T.S.Kwon a

aKorea Atomic Energy Research Institute, Daedeok-daero 1045, Yuseong, Daejeon, 34057, Korea *Corresponding author: djeuh@kaeri.,re.kr

  • 1. Introduction

The mixing behavior of injected cold leg coolant or emergency core cooling water inside the reactor vessel is very important in respect of the reactivity variation due to the change of boron concentration or coolant

  • temperature. Currently computational flow dynamic

analysis technology has been enhanced to adopt the multi-scale and multi-dimensional physical flow

  • behavior. However, the benchmarking data base is still

very limited to validate the analysis tools. The mixing characteristics were identified by measuring the impedance transport for an asymmetric injection of fluid having different impedance. A new instrumentation to accurately measure the impedance of fluid flowing through the cold leg and hot leg pipes was

  • developed. The mixing factor represents the mixing

characteristics of the injected cold leg coolant inside reactor vessel, which is one of the important input parameters for the nuclear reactor safety analysis. The current study has the purpose of experimental DB generation for the flow mixing phenomena by using a promising facilities representing the prototype plant design.

  • 2. Methods and Results

2.1 Test Facilities [1][2] The reactor vessel and inner structures of the test facility are linearly reduced copies of the conventional PWR prototype. By preserving the major flow path geometry and placing a flow condition having a sufficient high Reynolds number, the Euler number of the prototype reactor has been preserved in the test facility. The current study developed a pipe core model representing the fuel assembly. The pipe inner diameter was determined by same flow area as the fuel assembly. Since the pipe model does not have crossflow, most of the mixing occurs before the flow enters core region, which can yield conservative mixing results. The configuration of the loop near the reactor vessel are same as the prototype plant. One cold leg, CL1A, among the four cold legs was utilized for the electrolyte

  • injection. A pressurized tank containing electrolyte is

connected to CL1A via flexible pipe. To simulate the impedance difference, the working fluid in the main system is demineralized water, and tap water mixing with NaSO4 was utilized for the trace fluid. 2.2 Instrumentation

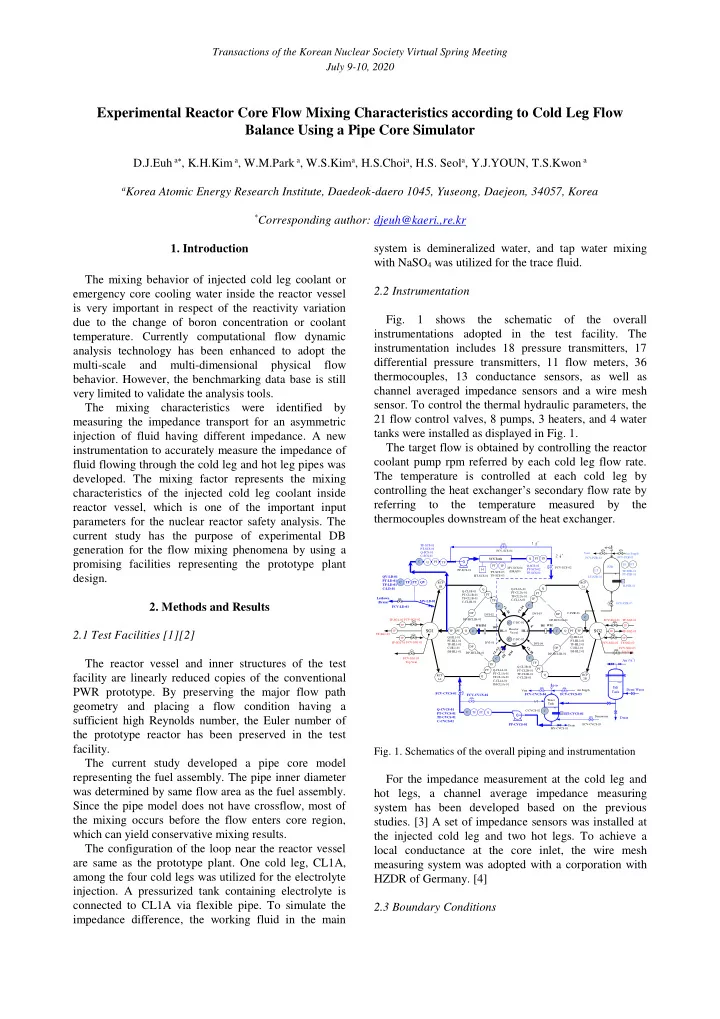
  • Fig. 1 shows the schematic of the overall

instrumentations adopted in the test facility. The instrumentation includes 18 pressure transmitters, 17 differential pressure transmitters, 11 flow meters, 36 thermocouples, 13 conductance sensors, as well as channel averaged impedance sensors and a wire mesh

  • sensor. To control the thermal hydraulic parameters, the

21 flow control valves, 8 pumps, 3 heaters, and 4 water tanks were installed as displayed in Fig. 1. The target flow is obtained by controlling the reactor coolant pump rpm referred by each cold leg flow rate. The temperature is controlled at each cold leg by controlling the heat exchanger’s secondary flow rate by referring to the temperature measured by the thermocouples downstream of the heat exchanger.

CL-1B C L

  • 1

A DP-HCL1A-01 DP-HCL1B-01 Q-CL1B-01 PT-CL1B-01 TF-CL1B-01 C-CL1B-01 TF TF-SG2-03 FCV-SG2-02 IM CL-2A C L

  • 2

B DP-HCL2B-01 DP-HCL2A-01 DVI-01 DVI-04 DVI-03 RCP 1A RCP 2B DVI-02 C PZR Air Supply Vent TF TF TF DP

SG2

C C C-PZR-01 TF-SG2-02 C

SG1

TF-SG1-03 TF-SG1-01 FCV-SG1-01 TF PT PT Q DP PT PT Q Q DP DP PT PT Q TF TF Q-HL1-01 PT-HL1-01 TF-HL1-01 C-HL1-01 IM-HL1-01 IM WM Reactor Vessel HL-1 HL-2 IM WM FCV-PZR-02 FCV-PZR-01 H C C C-DC-02 C-DC-01 FCV-PZR-03 TF-PZR-01 LT-PZR-01 PT-PZR-01 PT TF LT H-PZR-01 WM Q-HL2-01 PT-HL2-01 TF-HL2-01 C-HL2-01 IM-HL2-01 TF TF TF-SG1-02 FCV-SG1-02 TF TF FCV-SG2-01 TF-SG2-01 TF Q Q-CL2A-01 PT-CL2A-01 TF-CL2A-01 C-CL1A-01 Q Q-CL2B-01 PT-CL2B-01 TF-CL2B-01 C-CL2B-01 Q-CL1A-01 PT-CL1A-01 TF-CL1A-01 C-CL1A-01 IM-CL1A-01 RCP 1B RCP 2A C C C 00 1800 900 FCV-SG1-03 Top Vent FCV-SG2-03 Top Vent C Q FCV-CVCS-01 Q-CVCS-01 PT-CVCS-01 TF-CVCS-01 C-CVCS-01 PT TF FCV-CVCS-02 PP-CVCS-01 Water Tank Air Supply Vent Drain H MV-CVCS-01 FCV-CVCS-04 FCV-CVCS-03 HT-CVCS-01

Salt Tank Drain Air (½”) Demi Water

Demiwater FCV-CVCS-05 MV-LD-01 PT TF QV C QV-LD-01 PT-LD-01 TF-LD-01 C-LD-01 FCV-LD-01 Letdown (Drain) SCS Tank PP-SCS-01 TF TF Q PT PT FCV-SCS-04 Q FCV-SCS-02 TF-SCS-01 PT-SCS-01 Q-SCS-01 C-SCS-01 Q-SCS-02 PT-SCS-02 TF-SCS-02

H

C HT-SCS-01 TF PT PT-SCS-03 TF-SCS-03 MV-SCS-04 (DRAIN)

2 ½” 1 ½”

C-CVCS-02 C

  • Fig. 1. Schematics of the overall piping and instrumentation

For the impedance measurement at the cold leg and hot legs, a channel average impedance measuring system has been developed based on the previous

  • studies. [3] A set of impedance sensors was installed at

the injected cold leg and two hot legs. To achieve a local conductance at the core inlet, the wire mesh measuring system was adopted with a corporation with HZDR of Germany. [4] 2.3 Boundary Conditions

Transactions of the Korean Nuclear Society Virtual Spring Meeting July 9-10, 2020

slide-2
SLIDE 2

The uniform and non-uniform cold leg flow conditions were considered. The uniform flow cases mean that all the cold leg flow rates entering the reactor vessel are

  • same. A uniform downcomer flow distribution is

expected for the same cold leg flow conditions. The

  • ther cases are non-uniform conditions, which have

lower flow at one of cold leg and lager at the other three cold legs. The flow ratio is summarized at Table 1. The 10 test cases data for uniform and non-uniform flow conditions respectively, are ensemble averaged in this study.

Table 1. Flow Rate Ratio of Each RV Boundary Leg Test Condition Flow Ratio ( each leg flow rate / total reactor flow rate) Flow Rate CL1A CL1B CL2A CL2B HL1 HL2 Uniform 0.25 0.25 0.25 0.25 0.5 0.5 Non- Uniform 0.175 0.275 0.275 0.275 0.45 0.55

Since the current test focuses on the flow characteristics, the test were performed at 0.3 MPa and

  • 60oC. The flow rate corresponds to 1/38.5 Re number of

prototype condition. 2.4 Results In this paper, the key characteristics of the core mixing behavior were highlighted. Fig. 2 shows the core inlet mixing factor distribution for the uniform cold leg flow condition, which shows a concentration peak at almost 225o. However, the tracer injected cold leg, CL1A, is actually connected to the reactor vessel at 240o .which is slightly lower position then the concentration peak location. It is evidence that the injected tracer is moved clock-wise toward the hot leg 1 position inside the downcomer. The movement can be explained by the transition for the momentum balance for the even flow distribution. The pressure near the hot leg nozzle is expected to be lower than the other at core

  • utlet due to the flow merging at the exit nozzle. It can

induce a momentum to move the injected cold leg flow to the hot leg angle.

  • Fig. 3 shows the core inlet mixing factor distribution

for the unbalanced cold leg flow condition. The results shows the movement more drastically. Since the cold leg 1A flow is lower than the other cold leg flows, the injected tracer from the cold leg 1A gets forces laterally toward loop 1 side. Therefore the peak point of the concentration can be analyzed more shifted clock-wise than the results of the balanced flow conditions. The current dynamics is highly multi-dimensional flow behaviour, which is very valuable data for the validation

  • f the current multi-D flow dynamic analysis code.
  • Fig. 2. Contour of the core mixing factor under balanced flow

condition

  • Fig. 3. Contour of the core mixing factor under unbalanced

flow condition

  • 3. Conclusions

The present study performed experiments for identifying the flow mixing characteristics of the injected tracer of one cold leg at each fuel assembly

  • inlet. The facility was designed by the 1/5 linear scale

law and all the geometric and thermal hydraulic parameters were set based on the scale. The fuel assembly has been simplified by using the pipe model. The local mixing characteristics were identified at each fuel assembly by using wire mesh measuring system. The current study focused

  • n

the mixing characteristics under uniform and non-uniform cold leg flow conditions. The drastic non equilibrium mixing pattern were quantified in this study. High quality experimental data were produced by using the advanced impedance measuring systems, which is very unique based on the previous studies. The current experimental DB will be valuable for the evaluation of nuclear reactor performance. The

Transactions of the Korean Nuclear Society Virtual Spring Meeting July 9-10, 2020

slide-3
SLIDE 3

experimental DB can also be utilized for the CFD validation for the multi-dimensional flow behaviour. REFERENCES

[1] D.J.Euh et al, Methodology for the Reactor Flow Mixing Test - Part B, THRSD-ACOPV-DD-17-01, Rev. 00, (2017) [2] D.J.Euh et al, Mixing Factor Test Report, KAERI, KAERI/TR-7712/2019 (2019) [3] D. J. Euh, Ph. D Thesis, A Study on the Measurement Method and Mechanistic Prediction Model for the Interfacial Area Concentration, Seoul Univ., (2002) [4] Prasser H. M. et al. Coolant Mixing in a Pressurized Water Reactor: Deboration Transient, Steam-Line Breaks, and Emergency Core Cooling Injection, Nuclear Technology, 143, pp.37-56, (2002) Transactions of the Korean Nuclear Society Virtual Spring Meeting July 9-10, 2020