
SLIDE 1
Evaluation
Charles Sutton Data Mining and Exploration Spring 2012
Monday, 20 February 12
Evaluate what?
- Do you want to evaluate a classifier or a
learning algorithm?
- Do you want to predict accuracy or predict
which one is better?
- Do you have a lot of data or not much?
- Are you interested in one domain or in
understanding accuracy across domains?
Monday, 20 February 12
For really large amounts of data....
- You could use training error to estimate your test error
- But this is stupid, so don’t do it
- Instead split the instances randomly into a training set and test set
- But then suppose you need to:
- Compare 5 different algorithms
- Compare 5 different feature sets
- Each of them have different knobs in the training algorithm (e.g., size
- f neural network, gradient descent step size, k in k-nearest
neighbour, etc., etc.)
Monday, 20 February 12
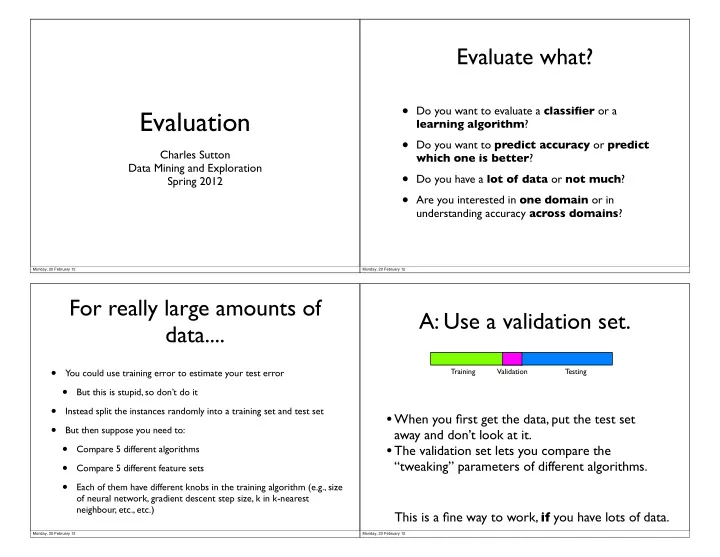
A: Use a validation set.
- When you first get the data, put the test set
away and don’t look at it.
- The validation set lets you compare the
“tweaking” parameters of different algorithms. This is a fine way to work, if you have lots of data.
Training Testing Validation
Monday, 20 February 12