
SLIDE 1
Evaluating Hypotheses
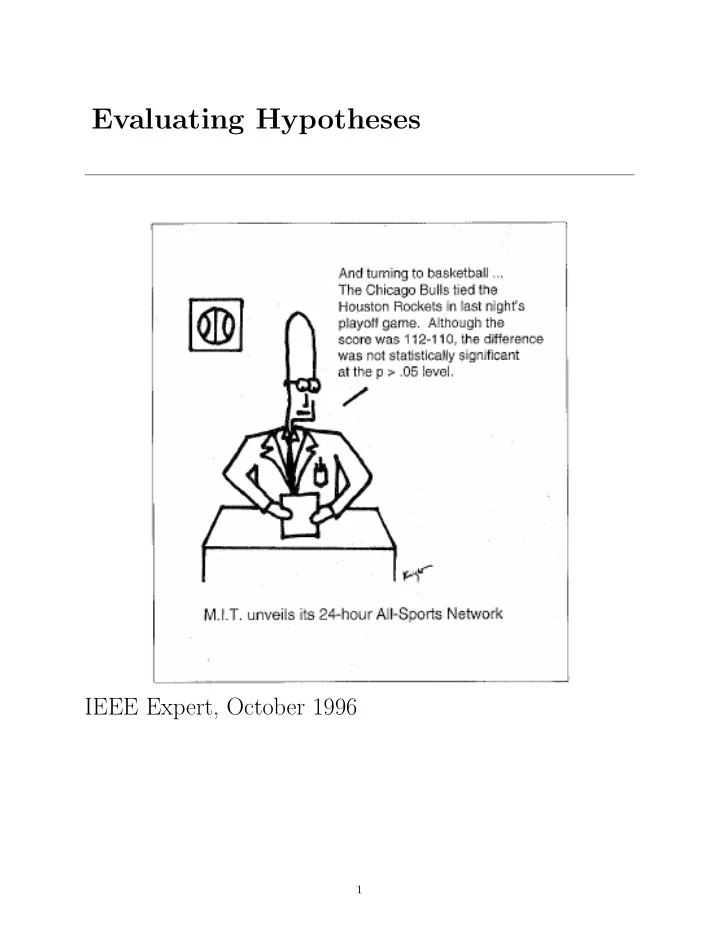
IEEE Expert, October 1996
1
Evaluating Hypotheses IEEE Expert, October 1996 1 Evaluating - - PDF document
Evaluating Hypotheses IEEE Expert, October 1996 1 Evaluating Hypotheses Sample error, true error Confidence intervals for observed hypothesis error Estimators Binomial distribution, Normal distribution, Central Limit Theorem
1
2
3
4
5
6
7
8
9
0.02 0.04 0.06 0.08 0.1 0.12 0.14 5 10 15 20 25 30 35 40 P(r) Binomial distribution for n = 40, p = 0.3
10
0.02 0.04 0.06 0.08 0.1 0.12 0.14 5 10 15 20 25 30 35 40 P(r) Binomial distribution for n = 40, p = 0.3
11
12
0.05 0.1 0.15 0.2 0.25 0.3 0.35 0.4
1 2 3 Normal distribution with mean 0, standard deviation 1
2(x−µ σ )2
b
13
0.05 0.1 0.15 0.2 0.25 0.3 0.35 0.4
1 2 3
14
15
0.05 0.1 0.15 0.2 0.25 0.3 0.35 0.4
1 2 3 0.05 0.1 0.15 0.2 0.25 0.3 0.35 0.4
1 2 3
16
17
18
σ ˆ
d ≈
n1 + errorS2(h2)(1 − errorS2(h2)) n2
ˆ d ± zN
n1 + errorS2(h2)(1 − errorS2(h2)) n2 19
20
21
22
23
24
25
26
27