
SLIDE 1
Hypotheses testing, p-values, Type I and Type II Errors
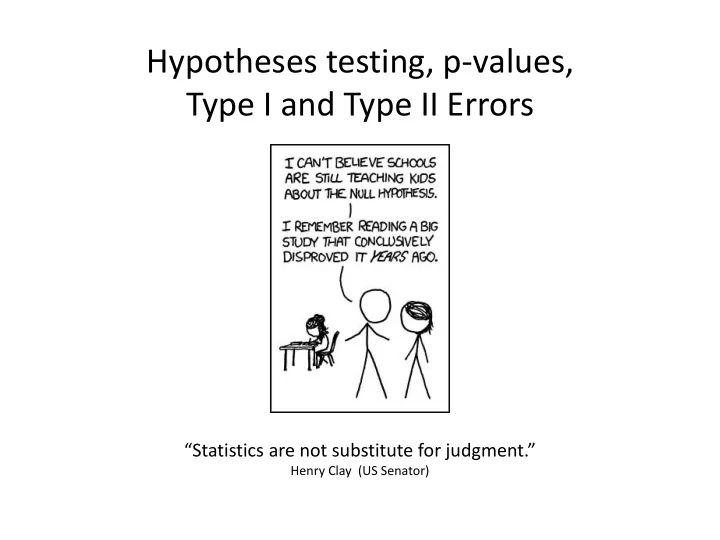
“Statistics are not substitute for judgment.”
Henry Clay (US Senator)
Hypotheses testing, p-values, Type I and Type II Errors Statistics - - PowerPoint PPT Presentation
Hypotheses testing, p-values, Type I and Type II Errors Statistics are not substitute for judgment. Henry Clay (US Senator) Formal hypotheses testing population A Is this a difference due B to random chance? Mean height A B sample
Henry Clay (US Senator)
sample population
Is this a difference due to random chance? Mean height Population sample
T-value
(standard error)
P-value
(percentiles, probabilities)
(t-𝑤𝑏𝑚𝑣𝑓 ∗ 𝑇𝐹𝑦) + 𝑦 Original units 𝑟𝑢(𝛽, 𝑒𝑔) (𝑤𝑏𝑚𝑣𝑓 − 𝑦 )/𝑇𝐹𝑦 p𝑢(t−𝑤𝑏𝑚𝑣𝑓, 𝑒𝑔)
1 2 3
0.001 0.999 0.50
-level Test p-value
Significant
Test p-value
Not Significant
Mean height Population sample
Theory: We can never really prove if the 2 samples are truly different or the same – only ask if what we observe (or a greater difference) is due to random chance
The lower the probability a difference is due to random chance – the more likely is the result of an effect (what we test for)
Null hypothesis is true Alternative hypothesis is true Fail to reject the null hypothesis Correct Decision
Incorrect Decision False Negative Type II Error Reject the null hypothesis Incorrect Decision False Positive Type I Error
Correct Decision
it is actually true
(H0) when it is not true
Remember rejection or acceptance of a p-value (and therefore the chance you will make an error) depends on the arbitrary -level you choose
The -level you choose is completely up to you (typically it is set at 0.05), however, it should be chosen with consideration of the consequences of making a Type I or a Type II Error. Based on your study, would you rather err on the side of false positives or false negatives?
Birch Mountain Wildlands
HO: Range of the current climate for the BMW protected area
= Range of the BMW protected area under climate change
Ha: Range of the current climate for the BMW protected area
≠ Range of the BMW protected area under climate change
If we reject HO: Climates ranges are different, therefore
genetic resources are not adequately protected and new protected areas need to be created
Consequences if I make:
adequately protected in the BMW protected area – we created new parks when we didn’t need to
didn’t create new protected areas and we should have From an ecological standpoint it is better to make a Type I Error, but from an economic standpoint it is better to make a Type II Error Which standpoint should I take?
Given you are testing whether or not what you observed or greater is due to random chance, more data gives you a better understanding of what is truly happening within the population, therefore sample size will the probability of making a Type 2 Error