
SLIDE 1
Evaluating Governmental Efforts to Combat the Chicago Urban Heat - - PowerPoint PPT Presentation
Evaluating Governmental Efforts to Combat the Chicago Urban Heat Island Chris Mackey, Ron Smith, Xuhui Lee Evaluating Governmental Efforts to Combat the Chicago Urban Heat Island Questions: 1) Have policies produced impacts large enough be
1) Have policies produced impacts large enough be detected in coarse- grained satellite images such as LANDSAT? 2) If so, have the reflective or vegetative strategies been generally more effective? 3) Which specific methods seem to be the most effective in the study period?
(Night of August 13th, 2007) (ASTER)
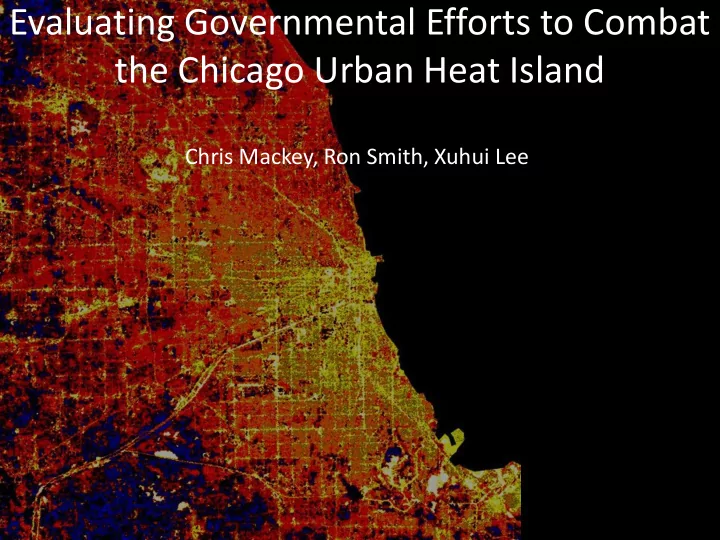
(the study area) ASTER
(Day of June 5th, 2009) (LANDSAT)
LANDSAT True Color
Start of Heat Island Policy
LANDSAT True Color
Present
LANDSAT True Color
Start of Heat Island Policy
LANDSAT True Color
Present
LANDSAT True Color
Present
Date Wind Speed (knots)* Wind Direction (o)* Humidity (%)* Cloud Cover (%)
Rainfall (in)
Early June May 30th 1995 10 325 51 4.47 June 5th 2009 20 40 67 3.63 Difference +10 75 +16
Early July July 1st 1995 15 355 67 2.3 1.4 July 2nd 2007 8 125 52 2.29 Difference
130
+0.89 Heat Wave August 3rd 2007 9 310 65 3.86
Date Avg LANDSAT Srf Temp (oC) Midway Air Temp (oC) O'Hare Air Temp (oC) Balloon Air Temp (oC)*
Early June May 30th 1995 29.8 19.4 20.0 15.0 June 5th 2009 30.9 18.3 16.7 13.4 Difference +1.1
Early July July 1st 1995 29.8 16.7 18.3 12.2 July 2nd 2007 30.2 20.0 18.9 17.6 Difference +0.4 +3.3 +0.6 +5.4 Heat Wave August 3rd 2007 37.6 23.3 26.7 23.8
* reading taken from a weather balloon sounding in Lincoln IL at a pressure/height of 925 hpa
1) Have policies produced impacts large enough be detected in coarse-grained satellite images such as LANDSAT?
Date Number of Vegetated Pixels % Vegetation in Scene
Rainfall (in)
Early June May 30th 1995 187,458 27.2 4.47 June 5th 2009 177,773 26.3 3.63 Difference
Early July July 1st 1995 178,127 27 1.4 July 2nd 2007 282,262 42.8 2.29 Difference +104,135 +15.8 +0.89 Heat Wave August 3rd 2007 325,195 48.2 3.86
Image Displays Early June Change
It is uncertain whether the total vegetation of Chicago increased or decreased in the test period since the detectability of vegetation varies greatly from year to year and even month to month. This is probably because precipitation varies widely.
Date Entire City Albedo Non-Vegetated Non-Water Albedo
Rainfall (in)
Early June May 30th 1995 0.11665 0.117019 4.47 June 5th 2009 0.135543 0.140415 3.63 Difference +0.018893 +0.023396
Early July July 1st 1995 0.11895 0.119802 1.4 July 2nd 2007 0.125028 0.132466 2.29 Difference +0.006078 +0.012664 +0.89 Heat Wave August 3rd 2007 0.132388 0.141301 3.86 Note: Albedo Values are taken after a dark object subtraction and thus are probably all lower than true albedo values. Image Displays Early June Change
Chicago’s albedo, like its vegetation, seems to display some variation with precipitation. The variance may also be the result of a reflective policy passed in 2008 that might have generated significant albedo changes between 2007 and 2009. Unlike vegetation, it is fairly certain that the overall albedo of the city increased in the test period.
However, both areas that clearly gained vegetation and areas that clearly lost vegetation are visible in fairly similar quantities over the city (policies are noticeable).
estimated that this was by 0.0125 .
more noticeable than vegetation changes suggests that reflective policies and efforts may have had a more significant impact on the whole city than vegetation policies.
2) Have the reflective or vegetation strategies been generally more effective?
21 23 25 27 29 31 33 35 37 0.3 0.4 0.5 0.6 0.7 0.8 Temperature (oC) NDVI
June 1995 NDVI to Temperature
21 23 25 27 29 31 33 35 37 0.3 0.4 0.5 0.6 0.7 0.8 Temperature (oC) NDVI
June 2009 NDVI to Temperature
correlation = -0.620 correlation = -0.664
21 23 25 27 29 31 33 35 37 0.3 0.4 0.5 0.6 0.7 0.8 Temperature (oC) NDVI
July 1995 to Temperature
21 23 25 27 29 31 33 35 37 0.3 0.4 0.5 0.6 0.7 0.8 Temperature (oC) NDVI
July 2007 NDVI to Temperature
correlation = -0.652 correlation = -0.699
27 29 31 33 35 37 39 41 43 0.3 0.4 0.5 0.6 0.7 0.8 Temperature (oC) NDVI
August 2007 NDVI to Temperature
correlation = -0.680
Urban NDVI above .3 is strongly correlated to lower temperatures
(Parks and areas of dense vegetation are the coolest)
21 23 25 27 29 31 33 35 37 0.1 0.2 0.3 0.4 0.5 Temperature (oC) Albedo
June 1995 Albedo to Temperature
correlation = -0.065
21 23 25 27 29 31 33 35 37 0.1 0.2 0.3 0.4 0.5 Temperature (oC) Albedo
June 2009 Albedo to Temperature
correlation = -0.187
21 23 25 27 29 31 33 35 37 0.1 0.2 0.3 0.4 0.5 Temperature (oC) Albedo
July 1995 Albedo to Temperature
21 23 25 27 29 31 33 35 37 0.1 0.2 0.3 0.4 0.5 Temperature (oC) Albedo
July 2007 Albedo to Temperature
correlation = -0.109 correlation = -0.165
27 29 31 33 35 37 39 41 43 0.1 0.2 0.3 0.4 0.5 Temperature (oC) Albedo
August 2007 Albedo to Temperature
correlation = -0.082
Urban albedo is very weakly correlated to lower temperatures
(More reflective surfaces are not necessarily cooler)
caused by a removal of vegetation (as opposed to decreases in albedo of some surfaces).
are often the coolest parts of a city in Summer.
abundant vegetation to the level of an urban park throughout the city.
2) Have the reflective or vegetation strategies been generally more effective?
Early June Image Pair Temperature Change
Early July Image Pair Temperature Change
Temperature Change Comparison
Image Pair
Change (oC)
Deviation (oC) June +1.10 1.65 July +0.41 1.92
Correlation of +0.484
Errors can probably be explained by changes in water levels or infrastructure changes between 2007 and 2009. The method is not perfectly consistent but at least there is a mildly-strong correlation that is positive.
Correlation of +0.484
Emissivity Temperature Error
Avg Emissivity of Whole Scene = 0.954 Avg Emissivity of Vegetated Pixels = : 0.956 Avg Emissivity of Non-Vegetated Pixels = 0.951
2 4 6 8 0.1 0.2 0.3 0.4 0.5 Temperature Change (oC) NDVI Change
June 1995 to 2009 Positive NDVI Change to Temperature Change
2 4 6 8 0.1 0.2 0.3 0.4 0.5 Temperature Change (oC) NDVI Change
July 1995 to 2007 Positive NDVI Change to Temperature Change
correlation = -0.108 correlation = -0.117
1 3 0.1 0.2 0.3 0.4 0.5 Temperature Change (oC) Albedo Change
June 1995 to 2009 Positive Albedo Change to Temperature Change
1 3 0.1 0.2 0.3 0.4 0.5 Temperature Change (oC) Albedo Change
July 1995 to 2007 Positive Albedo Change to Temperature Change
correlation = -0.311 correlation = -0.364
correlated to a temperature decreases (-0.113 ) while positive changes in albedo are fairly strongly correlated (-0.338 ).
reflective policies and efforts in the test period were more effective at cooling the city than the vegetation efforts.
3) Which specific methods seem to be the most effective and most promising?
1998 Single visible band 1 meter resolution 2010 True color visible bands 1 meter resolution
1998 2010
NDVI Change June: -0.014 (7px) July: +0.015 (20px) Albedo Change June: +0.078 July: +0.051
June: -3.52 oC July: -3.46 oC Present Emissivity Emissivity: 0.948 Error from Mean: +0.48 oC
1998 2010
NDVI Change June: 0 px July: 0 px Albedo Change June: + 0.207 July: + 0.180
June: -5.45 oC July: -4.64 oC Present Emissivity Emissivity: 0.948 Error from Mean: +0.47 oC
1998 2010
NDVI Change June: 0 px July: 0 px Albedo Change June: +0.166 July: +0.163
June: -4.48 oC July: -5.25 oC Present Emissivity Emissivity: 0.953 Error from Mean: +0.09 oC
1998 2010
NDVI Change June: 0 px July: 0 px Albedo Change June: +0.068 July: +0.064
June: +1.86 oC* July: -0.34 oC* Present Emissivity Emissivity: 0.956 Error from Mean: +0.18 oC * The large temperature difference probably has to do with the fact that the road was still under construction in 2007, which ended in October 2007. Thus,
there had been no cars driving on the road in the July image pair but there were cars in the June image pair, which must have heated it up.
1998 2010
NDVI Change Undetectable Albedo Change Undectable
Undetectable Present-day Emissivity Undetectable
1998 2010
NDVI Change June: +0.013 (39 px) July: +0.091 (58 px) Albedo Change June: +0.033 July: +0.010
June: -0.73 oC* July: -4.63 oC* Present Emissivity Emissivity: 0.954 Error from Mean: +0.02 oC * The large temperature difference probably has to do with the fact that there was a
breeze blowing off of the lake in the 2007 July image and the site is only a block away from the lake..
1998 2010
NDVI Change June: +0.044 (492 px) July: +0.080 (752px) Albedo Change June: +0.019 July: +0.004
June: + 0.48 oC July: +0.30 oC Present Emissivity Emissivity: 0.958 Error from Mean: -0.34 oC
1998 2010
NDVI Change June: +0.193 July: +0.120 Albedo Change June: +0.008 July: -0.017
June: -0.37 oC July: -0.47 oC Present Emissivity Emissivity: .963 Error from Mean: -0.67 oC
1998 2010
NDVI Change June: +0.117 (125 px) July: +0.106 (126px) Albedo Change June: +0.013 July: : -0.006
June: +0.46 oC July: -0.83 oC Present Emissivity Emissivity: 0.951 Error from Mean: +0.23 oC
1998 2010
NDVI Change June: + 0.178 July: still apartments Albedo Change June: +0.039 July: still apartments
June: +1.48 oC* July: still apartments Present Emissivity Emissivity: 0.956 Error from Mean: +0.18 oC * Likely the result of better air coupling of buildings
(Possibly an Effort of the City’s to Clean-Up Brownfield Sites)
1998 July 2010
NDVI Change June: +0.213 (68 px) July: +0.091 (59 px)* Albedo Change June: +0.058 July: +0.016*
June: -2.05 oC July: +0.481 oC* Present Emissivity Emissivity: 0.958 Error from Mean: -0.27 oC * Clearly, massive improvements must have been made between 2007 and 2009
(Lake Calumet Unit, Owned by Illinois International Port District)
1998 2010
NDVI Change June: +0.248 July: cloud-covered Albedo Change June: +0.022 July: cloud-covered
June: -2.28 oC July: cloud-covered Present Emissivity Emissivity: 0.966 Error from Mean: -0.91 oC
the result of new reflective roofs that were likely brought about by new energy efficiency zoning codes. Over the test period, this method appears to have been the most successful.
larger-scale efforts will be necessary to cool entire neighborhoods.
efforts does not significantly cool the area and much more abundant vegetation is necessary to produce the desired effects.
issue of urban heat island as suggested by the stronger correlation of NDVI to low temperatures in single images of the city, a reflective strategy might be much more effective at least over a short period.
heat island over the test period of this study, Chicago might consider intensifying its current policies in this area. Also, other cities combating urban heat island might consider implementing similar policies.