
SLIDE 1
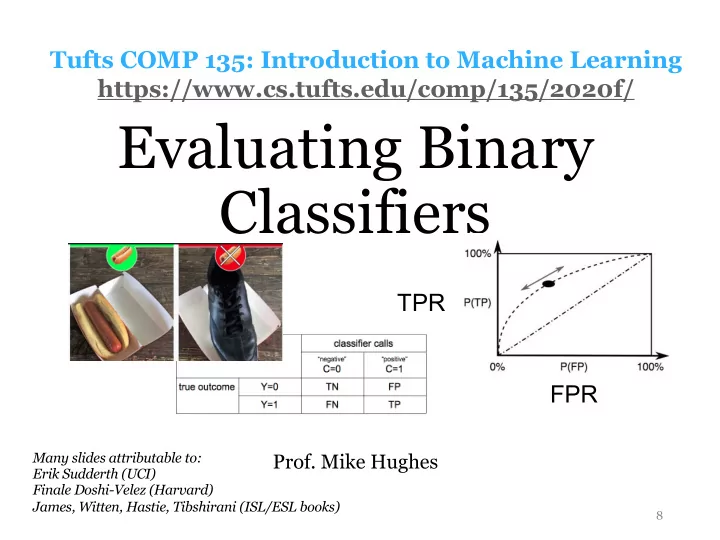
Evaluating Binary Classifiers
8
Tufts COMP 135: Introduction to Machine Learning https://www.cs.tufts.edu/comp/135/2020f/
Many slides attributable to: Erik Sudderth (UCI) Finale Doshi-Velez (Harvard) James, Witten, Hastie, Tibshirani (ISL/ESL books)
- Prof. Mike Hughes
FPR TPR