SLIDE 4 Take care in interpreting prevalence data
Combining prevalence with other data is usually more informative: Are there dead or dying animals? P(disease) often increases with intensity of infection
low prevalence of high intensity infections is more consistent with a die-
- ff than low intensity infections
Susceptibility of the species of interest
low prevalence in a very susceptible species would be interpreted differently than similar prevalence in a very tolerant species
Timing/phenology
low prevalence in young larvae could mean low susceptibility/ transmission OR very early in an epidemic
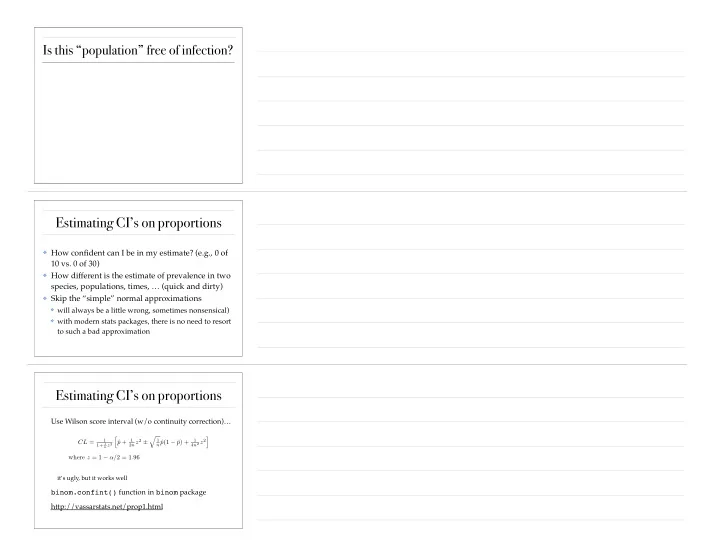
Comparing prevalence: Chi-square tests
❖ Can accommodate multiple groups (e.g., ponds, species,
whatnot)
❖ Simple to calculate (even by hand) ❖ Requires that expected count in all cells be ≥5 which
may be difficult with low sample sizes and/or low (or very high) prevalence
χ2 =
n
X
i=1
(Oi − Ei)2 Ei
Pop A Pop B Total Infected 10 20 30 Not infected 25 25 50 Total 35 45 80
Comparing prevalence: Chi-square tests
χ2 =
n
X
i=1
(Oi − Ei)2 Ei
Pop A Pop B Total Infected 10 20 30 Not infected 25 25 50 Total 35 45 80
If there is no difference between the two populations, we would expect the proportion infected to be the same in both: 30/80=0.375 Of the 35 sampled in Pop A, we expect 35 × 0.375 = 13.125 infections. Similarly we would expect 45 × 0.375 = 16.875 infected in Pop B. The expected number of uninfected in each pond is calculated similarly: 35 × (50/80) = 35 × 0.625 = 21.875 uninfected in population A, and 45 × (50/80) = 45 × 0.625 = 28.125