Estimate of P TOTAL = B TOTAL P B jh 610, 1991 page 1 RECENT / - - PDF document

estimate of p total b total p b
SMART_READER_LITE
LIVE PREVIEW

Estimate of P TOTAL = B TOTAL P B jh 610, 1991 page 1 RECENT / - - PDF document

E XAMPLE OF SAMPLE SURVEY TO ESTIMATE THE POPULATION OF F RANCE (proposed by Laplace in the 1780's; employed in 1802) Determine the number of births in France in the past year from the birth registers (considered to be quite accurate) Multiply


slide-1
SLIDE 1

EXAMPLE OF SAMPLE SURVEY

TO ESTIMATE THE POPULATION OF FRANCE

(proposed by Laplace in the 1780's; employed in 1802)

Determine the number of births in France in the past year from the birth registers (considered to be quite accurate) Multiply this number by the ratio of population to births. Estimate the ratio, not by a complete census of the country, but by a census in a few carefully selected communities

"The most precise method of obtaining the ratio of population to births consists, (1.) in choosing departments distributed in an almost equal manner over the whole surface of the country, so as to render the general result independent of local circumstances; (2.) in carefully enumerating at a given time, the inhabitants of several communities in each of these departments; (3.) by determining the mean number of the annual births for each community from the registers of births during several years that precede and follow this

  • period. This number, divided by that of the inhabitants, will give the ratio of the

annual births to the population in a manner that is the more accurate as the enumeration is more extensive... In 30 departments spread out equally over the whole of France, communities have been chosen which would be able to furnish the most exact information" (Laplace 1814, from Stigler's book on history of statistics)

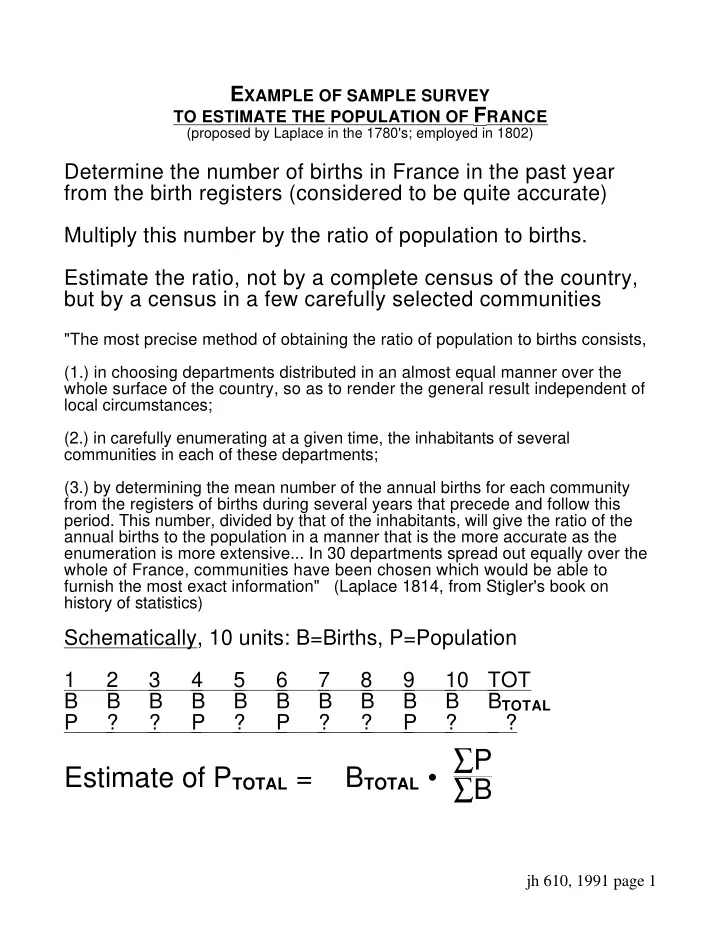
Schematically, 10 units: B=Births, P=Population 1 2 3 4 5 6 7 8 9 10 TOT B B B B B B B B B B BTOTAL P ? ? P ? P ? ? P ? ?

Estimate of PTOTAL = BTOTAL • ∑P ∑B

jh 610, 1991 page 1

slide-2
SLIDE 2

RECENT / LOCAL EXAMPLES OF SAMPLE SURVEYS

Chez les adolescentes de la province de Québec ?? % immunité à la rubéole ??

(l'Union Médicale du Canada; 1981)

For Boston and Massachusetts schoolchildren, ?? # of Decayed/Missing/Filled teeth per child

(DePaola et al; 1982)

For Montréal 2-year olds, ?? % have all appropriate immunizations?

(Baumgarten et al; 198x)

For Massachusetts and Quebec childbearing women, ?? percent of babies seropositive for HIV??

(Hoff NEJM 1988; Hankins 1989)

For Quebec population, ?? number, per capita, of visits to an MD ?? In a year, ?? proportion of the Quebec population

  • 1 "examen en cabinet" • rec'd psychiatric rx

(RAMQ Statistiques Annuelles, 1989)

In a year, in the population of New England ?? many hospitalized for burn injury ?? many treated and released for burn injury

(Hanley, Burke et al, 1991)

?? proportion of Quebec MD's

  • prescribe "newer" classes of anti-depressants
  • have seen various reactions with them

(Scott, Thompson, Hanley, Spitzer, 1989)

In period '55 - '85, in general medical journals, ?? number of authors per article

('55, '65, '75: Fletcher 1979; '85: 607 class of Summer '88)

Directory of Statisticians, '78 & '85 ?? many names [variable # per page] (607 class 1986-)

jh 610, 1991 page 2

slide-3
SLIDE 3

REASONS WHY SAMPLE SURVEYS USED Data not otherwise available Don't need the precision of a census

(sometimes, a census can actually be less precise)

Reduced costs and time Testing may be destructive

(In Quality Control, determinations on biological material, ..)

(blood samples, biopsies, ...)

$$ gained from 100% processing may be less than cost of the effort

(In financial accounts, telephone billing, )

Can pay more attention to ascertainment and to quality of measurements If use probability sampling, can measure the reliability of the sample estimates from the sample itself

jh 610, 1991 page 3

slide-4
SLIDE 4

TYPES OF SAMPLES Non-Probability convenience / availability

quota, accessibile, ...

judgemental / purposive

sampler "inspects, or knows something about" the whole, selects "typical" units that are "close", in sampler's opinion, to "average" of the population

volunteers

Kinsey report; "Dewey elected"

haphazard

pick numbers out of head; animals out of cage

Probability characterized by our ability (at least in theory) to:

  • list the set of possible samples that could

have been selected by the sampling procedure

  • assign each sample a known probability of

being selected

  • assure others that the selection plan was

followed

  • state how estimates are computed from the

sample data

jh 610, 1991 page 4

slide-5
SLIDE 5

STEPS IN SAMPLE SURVEY

  • TARGET POPULATION (ELEMENTS)*
  • WHAT INFORMATION IS NEEDED*
  • SAMPLE DESIGN

SAMPLING FRAME* SELECTION OF UNITS AND SUB-UNITS CONSTRUCTING ESTIMATORS;

PROJECTING UNCERTAINTY OF ESTIMATES may need pilot study to gauge variability Confidence Intervals's (CI's) if descriptive CI's / POWER if comparisons being made

LOCATING INDIVIDUAL ELEMENTS

actual identities may have to wait until field work starts; plan should give the steps to be followed

  • PRETEST
  • ORGANIZATION OF FIELD WORK
  • DATA COLLECTION AND PROCESSING*
  • DATA ANALYSIS

ESTIMATES AND UNCERTAINTY (CI'S, TESTS...) INFO GAINED FOR FUTURE SURVEYS

* procedures common to censuses & samples jh 610, 1991 page 5

slide-6
SLIDE 6

SOME TYPES OF SAMPLE SURVEYS

SIMPLE RANDOM SAMPLE ("unrestricted random sample") SYSTEMATIC (RANDOM) SAMPLE STRATIFIED RANDOM SAMPLE RATIO ESTIMATES FROM SRS'S SINGLE-STAGE CLUSTER SAMPLE MULTI-STAGE SAMPLE SOME REFERENCES BEDTIME READING

Slonim MJ Guide to Sampling Pan Books London 1968

revised and expanded for the first British Edition; first published under the title Sampling in a Nutshell by Simon and Shuster, New York, 1960) photocopy of selected portions on reserve in library

MIDDLE OF THE ROAD

Scheaffer, Mendenhall and Ott. Elementary Survey Sampling. Duxbury Press, N Scituate MA, 1979. Levy PS and Lemeshow S. Sampling for Health Professionals. Lifetime Learning Publications Belmont CA, 1980.

HIGHER MATHEMATICAL LEVEL (but still quite readable)

Cochran WG Sampling Techniques, Wiley, New York, 2nd (1963) and later editions.

FOR PROFESSIONAL SURVEY STATISTICIANS

  • Hansen, Hurwitz & Maddow. Sample Survey Methods and Theory

2 vols Wiley 1953

  • Kish L Survey Sampling Wiley, New York, 1965

jh 610, 1991 page 6

slide-7
SLIDE 7

AN IMPORTANT DISTINCTION

PRIMARY PURPOSE OF STUDY MAY BE TO: 1 OBTAIN MOST PRECISE (FOR THE $'S) ESTIMATE OF THE

AVERAGE (OR TOTAL) OF SOME VARIABLE FOR ENTIRE POPULATION

(1 ANSWER)

OR

2 OBTAIN ESTIMATES OF THE AVERAGE (OR TOTAL) OF SOME

VARIABLE FOR EACH OF SEVERAL "SUBDOMAINS" OF THE POPULATION

(1 ANSWER PER SUBDOMAIN)

OR

3 COMPARE ESTIMATES OF THE AVERAGE (OR TOTAL) OF SOME

VARIABLE IN EACH OF SEVERAL "SUBDOMAINS" OF POPULATION

(1 ANSWER PER COMPARISON) ALLOCATION OF SAMPLE SIZES WILL DIFFER DEPENDING ON WHICH OF THE 3 COMPETING OBJECTIVES IS PRIMARY

(STUDY MAY HAVE ALL 3 OBJECTIVES)

jh 610, 1991 page 7

slide-8
SLIDE 8

SIMPLE RANDOM SAMPLING

Population contains N units FORMALLY: SRS is a method of selecting n units out of N such that every one of the NCn samples has an equal chance of being selected IN PRACTICE, a SRS is drawn unit by unit: Units are numbered 1 to N Series of random numbers between 1 and N is drawn from, for example, a hat, bowl, ...

(in succession, without replacement)

a table of ("pre-drawn") random numbers

(discarding any number previously drawn)

Units which bear these numbers constitute the sample ESTIMATES

  • > sample mean, ybar, as estimate of µ(Y)
  • > N•ybar as estimate of TOTAL Y
  • > sample proportion, p, as estimate of (Y=1)
  • > N•p as estimate of TOTAL NUMBER OF Y=1

STANDARD ERRORS of these Estimates, if n N is SMALL SE(ybar) = sy n ; SE(p) = [1- ] n ; etc.. (1) STANDARD ERRORS of these Estimates, if n N is SIZEABLE Use FINITE POPULATION CORRECTION (FPC) i.e. multiply SE's in (1) by 1 - n N

see pages 3.1 - 3.5 of JH's notes from 607

jh 610, 1991 page 8

slide-9
SLIDE 9

STRATIFIED SAMPLING

PROCEDURE...

  • Population of N units is first divided into

subpopulations or "strata" of N1, N2, ... , NL units

  • respectively. The strata are non-overlapping, and

together they comprise the whole of the population, so that Ni = N.

  • To obtain full benefit of stratification, the Ni must be

known.

  • A sample is drawn from EACH STRATUM, with the

drawings being made independently in different strata.

  • If a SRS is taken in each stratum, the whole

procedure is described as stratified random sampling. RATIONALE...

  • if want precise estimates in each stratum, should

treat each subpopulation in its own right

  • administrative convenience in field work
  • can use different approaches in different strata
  • may gain in precision in estimates for entire

population, if strata are internally homogeneous relative to the variation between strata

________________________ see pages 3.5 - 3.6 of JH's notes from 607 (including a worked example of a stratified seroprevalence survey, in which, for sake of illustration, it is assumed that the samples within strata were simple random samples)

jh 610, 1991 page 9

slide-10
SLIDE 10

"STRATIFICATION"

THE DIFFERENT USES AND MEANINGS OF "STRATIFICATION"ARE OFTEN CONFUSED AND

POORLY UNDERSTOOD: CONTEXT MAIN PURPOSE

SAMPLE SURVEYS reduce (random) sampling variability in an estimate for the entire population SAMPLE SURVEYS separate estimates for subdomains (each subdomain of interest in&of itself)

shouldn't really be called "stratified" ETIOLOGIC STUDIES

reduce bias due to confounding & PPT* COMPARISONS i.e. make comparison "fairer" (it may also reduce sampling variability)

emphasis is on Single Comparative Index e.g. M-H technique, age-standardization, ... ETIOLOGIC STUDIES

describe variation in Comparative Index & PPT COMPARISONS across levels of "stratifying" variable

"effect modification"; better to say "separate" or "sub-"analyses stratified analysis yields 1 index

______________________________

*PPT: PERSON, PLACE AND TIME jh 610, 1991 page 10

slide-11
SLIDE 11

SINGLE-STAGE CLUSTER SAMPLING

PROCEDURE...

  • Population (of M elements) consists of N groups or "clusters" of M1,

M2, ..., Mi, ... , MN elements respectively. The clusters are non-

  • verlapping, and together they comprise the whole of the

population, so that Mi = M. The {Mi} need not be known ahead of time, but N must be.

  • Sampling unit consists of a cluster.
  • A sample of n clusters is drawn from the N; all the elements in each

selected cluster are measured.

  • If all the Mi are known, clusters can be selected with probability

proportional to their sizes Mi (can use selection with replacement). RATIONALE...

  • no reliable list of the elements of interest, and too expensive to

create one

  • balance reduced costs against greater SE's (less precision)

"casting as wide a net as possible" i.e. using smaller clusters, leaves less room for wild fluctuations in estimates, but cost of locating them may be prohibitive

  • if not a lot of variation in Y between clusters, lose little in precision,

and can save considerably in costs.

  • can think of systematic sampling as a kind of cluster sampling

e.g., systematic sample of size 5 from population of 15: 5 samples 1,6,11 2,7,12 3,8,13 4,9,14 5,10,15 "cluster"

  • 1-
  • 2-
  • 3-
  • 4-
  • 5-

jh 610, 1991 page 11