
SLIDE 1
Nove vembe ber r 2019
TSX.V: SKE/OTCQX: SKREF
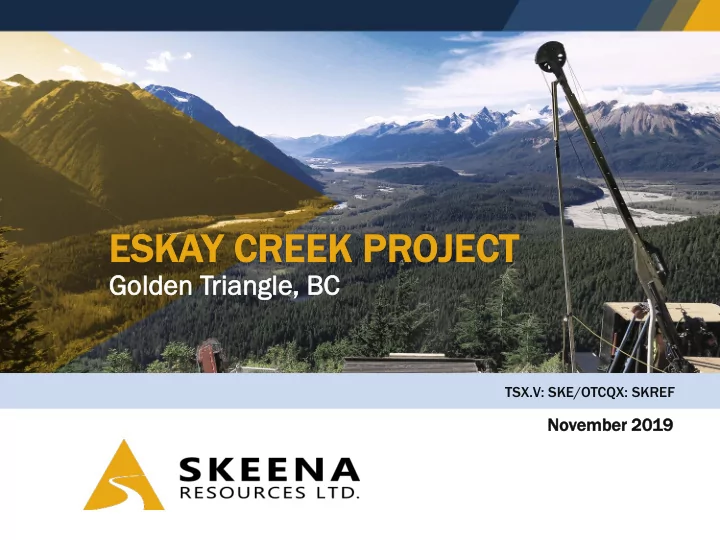
ESKAY CREEK PROJECT Golde den n Tria iang ngle, e, BC TSX.V: - - PowerPoint PPT Presentation
ESKAY CREEK PROJECT Golde den n Tria iang ngle, e, BC TSX.V: SKE/OTCQX: SKREF Nove vembe ber r 2019 FORWARD LOOKING STATEMENTS Certain statements made and information contained herein may constitute forward looking information and
Nove vembe ber r 2019
TSX.V: SKE/OTCQX: SKREF
Certain statements made and information contained herein may constitute “forward looking information” and “forward looking statements” within the meaning of applicable Canadian and United States securities legislation, including, among
available to the Company and there is no assurance that actual results will meet management’s expectations. Forward- looking statements and information may be identified by such terms as “anticipates”, “believes”, “targets”, “estimates”, “plans”, “expects”, “may”, “will”, “could” or “would”. Forward-looking statements and information contained herein are based
realization of resource and reserve estimates, metal prices, taxation, the estimation, timing and amount of future exploration and development, capital and operating costs, the availability of financing, the receipt of regulatory approvals, environmental risks, title disputes and other matters. While the Company considers its assumptions to be reasonable as of the date hereof, forward-looking statements and information are not guarantees of future performance and readers should not place undue importance on such statements as actual events and results may differ materially from those described herein. The Company does not undertake to update any forward-looking statements or information except as may be required by applicable securities laws. The Qualified Person responsible for the technical information in this presentation is Paul Geddes P. Geo., Vice President of Exploration & Resource Development, who has approved the technical information included herein. Any reference to historical estimates and resources should not be relied upon.These are not current and a Q.P. has not done sufficient work to classify these historical estimate and Skeena Resources Limited is not treating the historical estimate as a current resource estimate.
2
3
Don
Siem emen ens:
financial advisor with over 30 years of experience as a Chartered Accountant. Mr. Siemens currently serves as Director and Audit Committee Chair for Arizona Mining Inc., Atlantic Gold Corp., Eros Resources Corp. and Hansa Resources Ltd.
Bor
en R. Put utnam nam III III: Mr. Putnam is a professional
geologist with over 41 years of mineral industry experience, with a focus on exploration and asset evaluations. During the last 15 years Mr. Putnam has worked primarily as an analyst or advisor to several large investment funds in the US.
Is Isac Burstein urstein: Mr. Burstein is the Vice President of
Exploration & Business Development at Hochschild Mining PLC. Mr. Burstein has served Hochschild in various capacities including Vice President
Business Development, Manager for Project Evaluation, Exploration Manager for Mexico and Exploration Geologist.
Walt Walter er Coles Coles Jr Jr., Presid
esident, ent, CEO & Dir irect ector
has been CEO for several TSXV listed companies. Previously he was an analyst with Cadence Investment Partners and before that with UBS Investment Bank. Mr. Coles holds a B.A. in Economics from the University of Richmond.
Cr Craig ig Pa Parry, y, Chairm
Chairman: Mr. Parry is a geologist and has
served as CEO and President for several Australian and TSXV listed mining companies. He is currently the President & CEO of IsoEnergy Ltd., a co-founder and director of NexGen Energy Ltd and a Senior Advisor and founding- shareholder of EMR Capital.
And ndrew MacRi acRitchie, chie, CP
CPA, A, CA, CA, CF CFO & Co Corporat ate Secr ecreta etary: Mr. MacRitchie is a Chartered Public Accountant
who’s held management roles in several TSXV listed mining companies over his 16-year career. Mr. MacRitchie was previously with PricewaterhouseCoopers in the tax accounting
Paul ul Geddes es, P. Ge
lorat ation
Resour
Dev evel elop
ent: Mr. Geddes has more than 20 years of
exploration and resource development experience. He was an instrumental member of the Rainy River Resources team prior to the Company’s takeover by New Gold in 2013.
Ke Kell lly Earle, le, B. Sc
Geol
PIR . VP, Comm
Communi unicat ations ions:
with 9 years of experience working with junior mining
Business at Western University.
Jus ustin in Him Himmelri elrigh ght, B. Sc
Sc., M. Eng. VP, Sus Sustainab inabilit ility:
Mr. Himmelright has
25 years
experience in environmental management and developing social license for natural resource projects. He is a graduate of University of British Columbia.
MANAGEMENT: DIRECTO TORS:
4
access to power & infrastructure:
Smithers
Power Station within 17 km of Snip
Creek Power Station within 10 km of Eskay Creek
facilities in Stewart
$2 billion invested in infrastructure
5
6
mill llion ion ounces
go gold ld & 160 60 mill million ion ou
nces of
lver er at average grades of 45 45 g/ g/t Au Au & 2,22 224 g/t Ag Ag from 1994 to 2008
with cut-off grades of 15 g/t AuEq for mill ore and 30 g/t AuEq for direct shipping ore
database containing 7,881 drill holes totaling 706,904 metres (surface & underground)
world when in production
7
secured in December 2017:
▪ $3.5
million exploration spend commitment
3 years (complete)
▪ Purchase price of $10M plus bond
to post (total capped at $17.7M)
▪ Once exercised, Barrick has 12
months to exercise back-in right for 51% by paying Skeena 3x cumulative expenses, refunding $10M purchase price and 51% of bond
8
rade de open-pit pit averaging ng 3.23 3 g/t Au, 78 g/t Ag (4.17 7 g/t AuEq) (dilut uted) d)
tax NPV5%
5% of C$638M
8M (US$49 491M 1M) ) and 51% IRR at US$1,325/ 325/oz
6/oz z Ag
tax payback k period d of 1. 1.2 years s
productio duction n capita tal expendi nditures ures (CAPEX) ) of C$303M 3M (US$233M 233M)
tax NPV:CAPEX EX Ratio of 2.1:1
5,812 12,00 ,000 0 oz Ag ( (306,000 000 oz A AuEq)
n sustai ustaini ning ng costs ts (AISC) of C$983/ 83/oz z (US$75 757/o 7/oz) z) AuEq recovere ered
h costs ts of C$949/ 949/oz z (US$73 731/ 1/oz
) AuEq recovered red
0 tonne ne per day (TPD) mill and flot
ation n plant t producing ducing saleable le concentra ntrate
1.
Exchange Rate (US$/C$) of 0.77
2.
Cash costs are inclusive of mining costs, processing costs, site G&A, treatment and refining charges and royalties
3.
AISC includes cash costs plus estimated corporate G&A, sustaining capital and closure costs
4.
Gold Equivalent (AuEq) calculated via the formula: Au (g/t) + [Ag (g/t) / 82.8]
306,000 6,000 oz AuE uEq q
Annua ual Producti uction
51%
After-tax tax IRR
C$638M 38M
After-tax tax NPV5%
5%
US$75 757/oz 7/oz
AISC (AuEq)
4.17 g/t AuE uEq
Open-pi pit t Average Grade
9
Sensit nsitiv ivitie ties s to Commod mmodity ity Prices ces Lower Base Higher Case Case se Case
Gold Price ($US/oz) $1,200 $1,325 325 $1,500 Silver Price ($US/oz) $14 $16 $18 After-Tax NPV (5%)(C$M) $453 $638 $638 $878 After-Tax IRR (%) 40% 51% 63% After-Tax Payback (Years) 1.6 1.2 0.9 Average Annual After-Tax Free Cash Flow (Years 1-9)(C$M) $117 $147 $187
Proje
ct Econo nomics ics
After-Tax NPV (5%)(C$M) $638 After-Tax IRR 51% After-Tax Payback Period (Years) 1.2 After-Tax NPV:CAPEX Ratio 2:1:1 Pre-Tax NPV (5%)(C$M) $993 Pre-Tax IRR 63% Pre-Tax Payback Period (Years) 1.1 Pre-Tax NPV:CAPEX Ratio 3:3:1 Average Annual After-Tax Free Cash Flow (Year 1-9 (C$M) $147 LOM After-Tax Free Cash Flow (C$M) $959
21A 22 22 21B 21C 21C HW HW NEX
10 10
Grade Contained Ounces Tonnes AuEq Au Ag AuEq Au Ag (000) g/t g/t g/t
Indicated Mineral Resources Pit Constrained 12,711 6.0 4.5 117 2,455 1,818 47,791 Underground 819 8.2 6.4 139 218 169 3,657 Total Indicated 13,530 6.1 4.6 118 2,673 73 1,987 51,448 Inferred Mineral Resources Pit Constrained 13,557 2.8 2.2 42 1,230 984 18,455 Underground 295 8.2 7.1 82 78 68 778 Total Inferred 13,852 2.9 2.3 43 1,308 308 1,052 19,233
21C
Historical Stopes & Development 2019 Resource
estimated will be converted into mineral reserves.
extraction.
rounding effects.
Pit Constrained Resources Underground Resources
11 11
Zones) with 4 phases
dump
Waste Dump South Pit North Pit
12 12
21A 1A 21B 21C 21C NEX 109 22 22
OPEN
Footwall Feeders Exploration Potential Eskay Creek Depth Extension 22 Feeder Zone Depth Potential
2019 Resources Historical Stopes & Development Drillhole Intersections > 4.0 g/t AuEq >2.0 metres
21E 1E
13 13 SK-19-053
27.6 .61 g/t Au AuEq 9.40 40 m
SK-19-063:
314.0 .07 g/t Au AuEq 2.2 .21 m
SK-19-052
17.4 .49 g/t Au AuEq 7.5 .54 m
0.0 1.0 2.0 3.0 4.0 5.0 6.0 0.0 1.0 2.0 3.0 4.0 5.0 6.0 7.0 8.0
Averag age e Grades es (g/t) ) of Open-Pit Pit Developm elopment ent Projects jects World ldwide wide
14 14
Average ge Grades (g/t) ) of Open-Pi Pit t Develo lopmen ent Projec ects ts in North America a and Austr trali lia
North American and Australian Average Open-Pit Grade
Eska kay y Creek ek 4.34 g/t AuEq Open-Pit Pit
Worldwide Average Open-Pit Grade 1.50 g/t
Source: S&P Capital IQ
Eskay Creek ek 4.34 4 g/t AuEq Open en-Pi Pit
1.46 g/t
15 15
$1,683 $1,047 $825 $781 $673 $500 $403 $300 $277 $222 $213 $201 $112 $65 $65
Market et Cap ($M CAD)
Source: Agentis Capital, Oct 29, 2019
1.0x 0.9x 0.9x 0.8x 0.7x 0.6x 0.6x 0.6x 0.6x 0.6x 0.6x 0.5x 0.3x
x NAV
P/NA NAV 0.1x
$970 $684 $389 $360 $324 $310 $289 $233 33 $194 $161 $123 $113 $101 $74
16 16
SKE $233 (USD SD $M)
USD $M
337 330 306 6 259 218 198 190 124 120 116 98 97 95 79
LOM (koz AuEq Eq)
SKE +306 koz AuEq
Source: Argentis Capital, Oct.29, 2019
17 17
Eskay Creek LOM AISC
Produc ucti tion
25 25 50 50 75 75 100 All All-In In-Sus Sustainin ining g Cost t ($/o /oz) 500 1,0 ,000 1,5 ,500 2,0 ,000 2,5 ,500 3,0 ,000
Source: S&P Global Market Intelligence; Based on reported/actual data where available
Barrick July 2017)
to acquire 60%
1.1 1 million ion ounce ces s of gold d at average age grade de of 27.5 .5 g/t from 1991 to 1999
surface & underground drilling
development
delineation drilling planned for H2 2019
18 18
Un Under erground d drill illin ing at Snip hole le UG17-001
19 19
SKE 2016 Drillhole
16.2 .24 g/t Au Au 13.5 .50 m
Columbia Regional Mining Alliance (BCRMA)
Lisims Government, industry, AME BC & the provincial government to promote mining investment in the Golden Triangle of northwest BC
responsible resource development rooted in local partnerships
20 20
21 21
Capital al Struc ucture ture
Current Shares Outstanding 115,289,676 Market Capitalization (CAD$0.57) $65.7 Million 52 Week High $0.58 52 Week Low $0.27 Warrants (exp. March 2020 – June 2020, $0.90 – $1.00) 9,962,509 Options (exp. November 2019 – August 2024, $0.41 – $1.50) 11,502,000 Shares Fully Diluted 136,754,185 Strategic Ownership Hochschild Mining plc 6.5%
All figures as of Nov 6, 2019
Share Price - TSX.V: SKE
22 22
Kelly Earle, Vice President Communications
info@skeenaresources.com +1 604 684 8725 Suite # 650 - 1021 West Hastings Street Vancouver, BC V6E 0C3 Canada
www.sk skeena enare resou sources es.c .com
TSX.V: SKE / OTCQX: SKREF / FRA: RXFB
23 23
24 24
Assumptions
Gold Price (US$) $1,32 325 Silver Price (US$) $16 Exchange Rate (US$/C$) 0.77 Discount Rate 5% 5% Royalties 1% 1%
Processing
Processing Throughout (TPD) 6,850 50 Average Diluted Gold Grade (g/t) 3.23 Average Diluted Silver Grade (g/t) 78 78 Average Diluted Gold Equivalent Grade (g/t) 4.1 .17
Mining
Mine Life (Years) 8.6 Strip Ratio (Waste: Mineralization) 7.2 .2:1 :1 Total Tonnage Mined (kt) 175,2 ,270 Total Mineralized Material Mined (kt) 21,3 ,307
Production
Gold d Recover ery 91.1 .1% Silv lver er Recover ery 92.4 .4% LOM Gold d Product uctio ion n (koz) 2,022 LOM Silver er Product uction ion (koz) 49,8 ,872 LOM Gold d Equiv ivalen lent t Product uction ion (koz) 2,624 LOM Aver verage age Annu nual l Gold ld Product uction ion (koz) 236 LOM Aver verage age Annu nual l Silv lver er Product uction ion (koz) 5,812 LOM Aver verage age Annu nual l Gold ld Equiv ivalent alent Product uction ion (koz) 306
Contained Metals
Contained ained Gold d Ounces es (koz) 2,2 ,212 Contained ained Silver er Ounces es (koz) 53,4 ,404 Contained ained AuEq Eq Ounces es (koz) 2,857
Capital Expenditures
Pre-Production Capital Expenditures (C$M) $303 Sustaining Capital Expenditures (C$M) $27 Reclamation Cost (C$M) $52
Operating Costs
Mining Cost (C$/t Mined) $3.4 .44 Mining Cost (C$/t Milled) $26.3 .32 Processing Cost (C$/t Milled) $21.6 .64 G&A Cost (C$/t Milled) $6.0 .06 Total Operating Cost (C$/t Milled) $54.0 .03
Cash Costs and AISC
LOM Cash Cost (US$/oz
lver er By By-Pr Produc duct $582 LOM Cash Cost (US$/ $/oz
Eq) Co-Pr Produ
$73 731 LOM AISC C (US$ S$/oz
t of Silv lver er By- Product uct $615 LOM AISC C (US$ S$/oz
Eq) Co-Produc duct $757
25 25
Cont
ngenc ency Init itial al Sustaini staining LOM Tot
Mine
Pre-Stripping $62 $62 Mining Equipment $14 $6 $20 Mine Capital $7 $3 $9 Sub-Total Mine $4 $83 $9 $91
Processing
Bulk Earthworks $7 $7 Processing $74 $7 $81 Reagents & Plant Services $7 $1 $8 Tailings & Water Treatment $19 $2 $21 Onsite Infrastructure $22 $2 $23 Sub-Total Processing $21 $129 $12 $141
Infrastructure
Power $13 $13 TSF, Water Supply & Treatment $2 $4 $6 Sub-Total Infrastructure $5 $15 $4 $19 Total Directs $226 $24 $250 Indirects $7 $27 $27 Total Directs + Indirects $253 $24 $277
Owner’s Costs
$4 $10 $10 Total excluding contingency $263 $24 $287
Project Contingency
$40 $3 $43 Sub-total including contingency $303 $27 $330 Closure $52 $52
Tot
$303 $79 $382
26 26