
SLIDE 1
Photo: TH DeWitt, USEPA
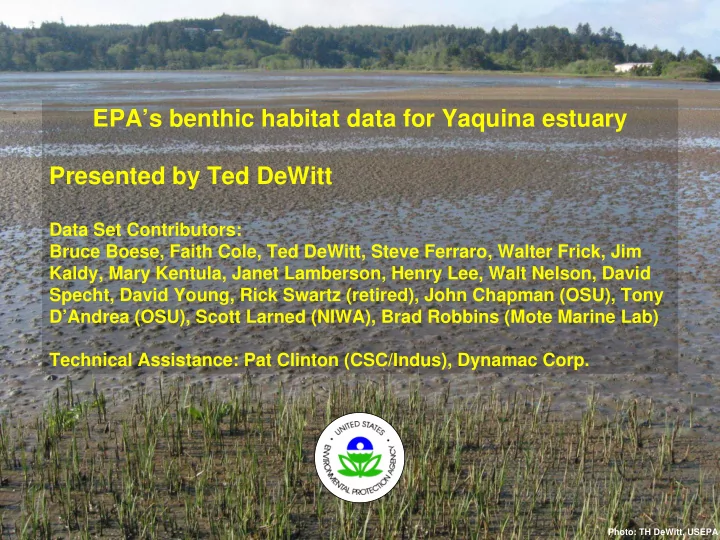
EPAs benthic habitat data for Yaquina estuary Presented by Ted - - PowerPoint PPT Presentation
EPAs benthic habitat data for Yaquina estuary Presented by Ted DeWitt Data Set Contributors: Bruce Boese, Faith Cole, Ted DeWitt, Steve Ferraro, Walter Frick, Jim Kaldy, Mary Kentula, Janet Lamberson, Henry Lee, Walt Nelson, David Specht,
Photo: TH DeWitt, USEPA
Map Description Year Month Habitat Extent of coverage
Aerial photomosaic, color infrared photographs 1997-2004 various; April-Sept Intertidal & channel whole estuary or lower & mid estuary Bathymetry + topography 1998, 1999, 2000, 2002 various intertidal & subtidal whole estuary Wind-wave exposure (modelled) 2000? ? Intertidal whole estuary Intertidal UVB Exposure 1996 seasonal Intertidal whole estuary Intertidal and subtidal habitats 1998-2002 N/A All lower & mid estuary Intertidal submerged aquatic vegetation (seagrass & macroalgae) 1997, 1998, 2004 various Intertidal lower & mid estuary Subtidal seagrass 2005 May-Sept Subtidal lower & upper estuary; limited areas Burrowing shrimp species, abundance 2002 May-July Intertidal whole estuary Amphipod Distribution (6 spp.) 1994, 1996, 1999 June-Aug Intertidal whole estuary
Map Description Year Month Habitat Extent of coverage West-East Landmarks
Macro-infauna (>1.0 mm) species, abundance 1975-1979 various Subtidal lower estuary; limited area HMSC Dock & SB Marina Macro-infauna (>0.5mm) species, abundance, biomass 1998, 1999, 2000 July-Aug Intertidal & subtidal lower & mid estuary SB Marina, OR Oyster docks Macro-infauna (>0.5mm) species, abundance, biomass 2002, 2004 Feb, July, Oct Intertidal & subtidal whole estuary Hwy 101 Bridge, Toledo Airport Mega-infauna (>3mm) species, abundance 1999 Aug Intertidal eelgrass lower estuary; limited area Sally's Bend Mega-infauna (>3mm) species, abundance 2004 Sept-Oct Intertidal & subtidal whole estuary Hwy 101 Bridge, Toledo Airport Burrowing shrimp species, abundance 1999, 2002, 2004 various Intertidal whole estuary Jetties, Toledo Airport Amphipods (6 species) 1994, 1996, 1999 June-Aug Intertidal whole estuary Hwy 101 bridge, Toledo PICES database of Native & Introduced Species N/A N/A all whole estuary N/A
HMSC, GP mill (Toledo) whole estuary Intertidal June 2004 Seagrass cover & shoot density, macroalgae cover & biomass HMSC, River Bend lower & mid estuary Intertidal eelgrass All 2001-2002
cover and volume RM 1, RM 8 lower estuary Intertidal & subtidal July-Aug 2000 Seagress and macroalgae, percent cover HMSC, Poole Slough lower & mid estuary Intertidal All 1999-2002
Idaho Flats, Poole Slough lower & mid estuary Intertidal eelgrass June-Sept, monthly 1998-1999
shoot density
West-East Landmarks Extent of coverage Habitat Month Year Map Description
Upogebia Neotrypaea Mixed Spp. 1-30 m-2 31-80 81-150 151-200 >200 0 m-2 1-50 m-2 51-150 151-280 281-400 >400 1-40 m-2 41-115 115-220 221-300 >300
DeWitt, T.H., A.F. D’Andrea, C.A. Brown, B.D. Griffen, and P.M. Eldridge. 2004. Impact of burrowing shrimp populations
American temperate estuaries. In: A. Tamaki (ed.), Proceedings of the Symposium on Ecology of Large Bioturbators in Tidal Flats and Shallow Sublittoral Sediments – from Individual Behavior to Their Role as Ecosystem
DeWitt, T.H., A.F. D’Andrea, C.A. Brown, B.D. Griffen, and P.M. Eldridge. 2004. Impact of burrowing shrimp populations on nitrogen cycling and water quality in western North American temperate estuaries. In: A. Tamaki (ed.), Proceedings
Sublittoral Sediments – from Individual Behavior to Their Role as Ecosystem
Hydrobiologia 553: 201-217
Submitted to Aquatic Botany.
DeWitt, T.H., A. Stevens, and A. Hyde. 2006. measuring the accuracy of seagrass maps produced from video and side scan sonar imagery: preliminary results for three sites in Yaquina estuary, Oregon. Poster
Harbor, WA, Feb. 2006.
Map Description Year Month Habitat Extent of coverage West-East Landmarks
Sediment grain size, TVS, metals, TOC 1975- 1979 various Subtidal lower estuary; limited area HMSC Dock, SB Marina Sediment %sand, silt, clay 1996 July- Aug Intertidal whole estuary Hwy 101 bridge, Toledo Sediment grain size, water content, organic content 1998 - 2000 July Intertidal & subtidal lower & mid estuary SB Marina, OR Oyster docks Sediment grain size, salinity, temperature 2004 June Intertidal whole estuary Jetties, Toledo Bend Sediment grain size, water content, organic content 2002, 2005 May, Oct Intertidal & subtidal whole estuary Jetties, Toledo Bend Sediment temperature 1998- 2006 All Intertidal lower & mid estuary transects on various flats: Idaho Flat, Sally's Bend, Riverbend, Craigie Pt.
Percent Sand