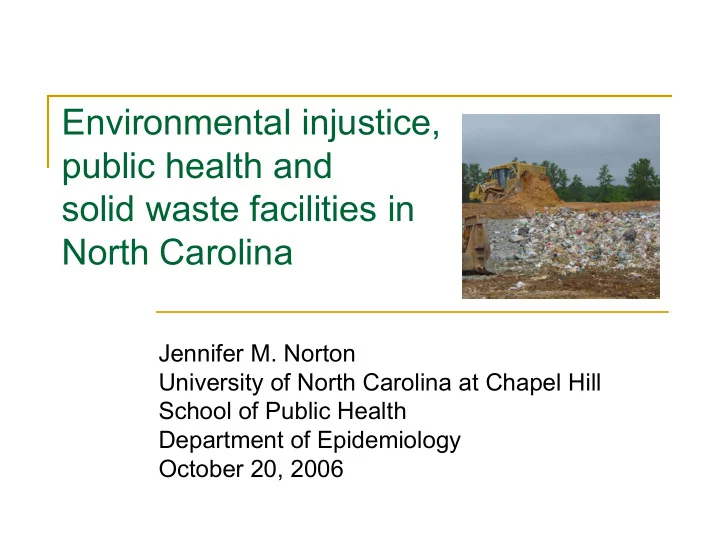

Environmental injustice, public health and solid waste facilities in North Carolina Jennifer M. Norton University of North Carolina at Chapel Hill School of Public Health Department of Epidemiology October 20, 2006
Outline � What is a solid waste facility? � How can solid waste facilities affect public health? � Are people of color and poor communities in North Carolina disproportionately burdened with solid waste facilities? How did we study this question? � What did we find? � What do the results mean? � What can be done? �
What is a solid waste facility? Aerial Photo: Orange County Solid Waste Landfill Complex Photo from TerraFly.com
Types of Solid Waste Facilities Facility type Examples of wastes managed MSWLF Municipal Solid Waste Garbage, sludge Landfill CDLF Construction & Demolition Drywall, concrete, Debris Landfill electrical fixtures TRANSFER Waste Transfer Station Garbage INDUS Industrial Solid Waste Pulp paper sludge, Landfill ash from power generation TIRELF Tire Landfill Tires
How can solid waste facilities affect public health? Photo: Unlined Municipal Solid Waste Landfill (closed) Orange County, NC Photo courtesy of Ginger Thompson Guidry, 2004
Potential Environmental Hazards Associated with Solid Waste Facilities � Water � Groundwater contamination from leachate (‘garbage-juice’) � Air � Landfill gases Malodor � Explosions � � Noise � Traffic safety Photo: Scale House at Orange County Solid Waste Landfill Photo courtesy of Ginger Thompson Guidry, 2004 � Community resources
Are people of color and poor communities in North Carolina disproportionately burdened with solid waste facilities?
How did we study this question? Photo: Lined Municipal Solid Waste Landfill (open) Orange County, NC
Data Sources � United States Census Bureau � Census block groups were used to define communities � North Carolina Division of Waste Management � Reviewed facility records to obtain information: � Permit dates � Location
Measures � Block group � Percent people of color population � Median house value (community economic wealth) � Other factors related to solid waste facilities and race/wealth � Population density (persons per square mile) � Region of the state � Identified communities with and without solid waste facilities
What did we find? Photo: Construction & Demolition Debris Landfill Orange County, NC
Location of Solid Waste Facilities in North Carolina Communities, 2003 � The odds of a solid waste facility: � 2.1 times higher in less-white communities compared to white communities � 1.4 times higher in less-wealthy communities compared to high-wealth communities
Location of Newly Permitted Solid Waste Facilities in North Carolina Communities, 1990-2003 � The rate of newly permitted solid waste facilities among communities that did not previously have one: � 2.2 times greater in less white communities compared to white communities � The rate of newly permitted privately owned or operated solid waste facility: � 2.4 times greater in less white communities compared to white communities
What do these results mean? Photo: Leachate collection pond at Orange County Landfill Photo courtesy of Ginger Thompson Guidry, 2004
Summary � The results of this statewide analysis validate the concerns communities have raised regarding the location of solid waste facilities in people of color and poor communities
What can be done? Editorial cartoon source: Dwane Powell, Raleigh News & Observer, October 26, 2005
Next Steps � Solid waste production is a problem � Lack of incentives to reduce waste may lead to continued ‘dumping’ on other communities � Communities can take action to raise awareness of solid waste issues
Permitted Solid Waste Facilities in NC Facility type Total # Open Closed Number permitted 1990-2003, only MSWLF 201 40 161 39 CDLF 75 63 12 73 TRANSFER 92 79 13 88 INDUS 48 10 38 6 TIRELF 3 2 1 1 SUM 419 194 225 207 Operation status on December 31, 2003 Source: Data compiled from records maintained by the NC Division of Waste Management
Data Sources � United States Census Bureau � Census block groups were used to define communities � North Carolina Division of Waste Management � Reviewed facility records to obtain information
Recommend
More recommend