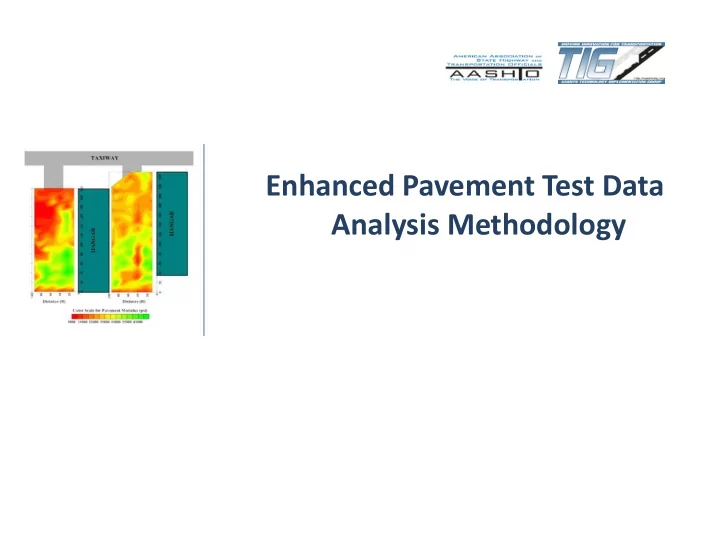

Enhanced Pavement Test Data Analysis Methodology
BACKGROUND Conventional Destructive Testing Methodologies Requires Traffic Maintenance Labor Intensive Time Consuming 2
Nondestructive Testing (NDT) Advantages of NDT Methodologies More data in less amount of time Improved safety No field samples (i.e., no damage to structure) 3
Presentation of NDT Data Typical Scatter Plot Widely used by engineers Effective for a large amount of data Good for a few survey lines 4
What If… NDT data collected along numerous survey lines Premature Failure Forensic Investigation Others? 5
Presentation of NDT Data? 6
Contour Plots “If Multiple 2 -D Plots Are Overwhelming, Contour Mapping Is The Way To Go!” 7
Concept of Contour Plots Contour Plot is a 2-D Representation of a 3-D Plot 8
Contour Plotting Software Commercial Software Available Surfer Dplot Others Cost Range Varies for Different Software Manuals and Training Sessions Available from Vendors 9
FDOT Example TAXIWAY NDT Survey of Airport Hangar Survey Premature Pavement Failure HANGAR FWD Survey Path Cracking FWD Survey Path FWD Survey Path FWD Survey Path FWD Survey Path FWD Survey Path FWD Survey Path FWD Survey Path FWD Survey Path FWD Survey Path FWD Survey Path FWD Survey Path FWD Survey Path FWD Survey Path HANGAR Depression/Heaving 14 FWD Scan Lines Survey Area 1 Survey Area 2 100 ft 100 ft Survey Offsets (ft) Total Sampling Survey Interval Area 1 Area 2 Lines (ft) 10, 25, 40, 55, 70, 85, 95 10, 25, 40, 55, 70, 85, 95 14 10 10
Scatter Plots??? There must be a better way! 11
Contour Plotting Map of Pavement Modulus Bird’s Eye View Easy to Understand 12
Then What? Select Critical Locations for Destructive Testing Penetration Test Dynamic Cone Penetrometer Soil Sampling 13
14
Recommend
More recommend