Embracing Subsea Digitalisation . Together 12 th June 2018 2002 - - PowerPoint PPT Presentation

embracing
SMART_READER_LITE
LIVE PREVIEW

Embracing Subsea Digitalisation . Together 12 th June 2018 2002 - - PowerPoint PPT Presentation

Embracing Subsea Digitalisation . Together 12 th June 2018 2002 Forbes Cover 2007 51% Market Share 2007 iPhone release 2008 Google Android 2013 Sold to Microsoft 2013 3% Market Share Digital Enablers Process


slide-1
SLIDE 1

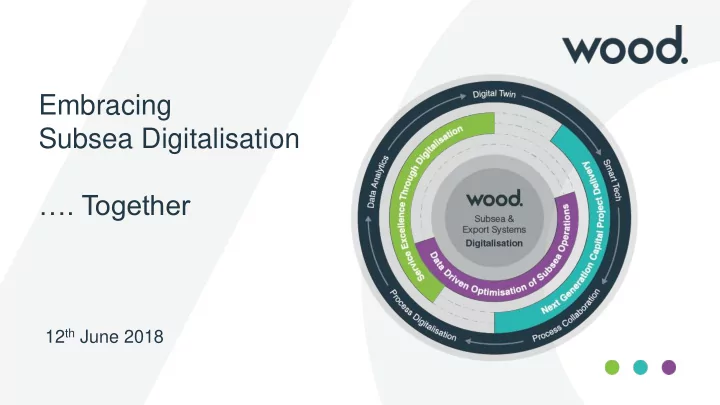
Embracing Subsea Digitalisation …. Together

12th June 2018

slide-2
SLIDE 2
  • 2002 Forbes Cover
  • 2007 51% Market Share
  • 2007 iPhone release
  • 2008 Google Android
  • 2013 Sold to Microsoft
  • 2013 3% Market Share
slide-3
SLIDE 3

Digital Enablers

3

Smart Technology & Robotics Data Analytics & Artificial Intelligence Process Digitalisation & Automation Digital Twin

slide-4
SLIDE 4

SSES Digital Framework & Goals

4

Digitalizing & automating internal processes to maximise efficiency and improve service delivery Leveraging data and smart technology to optimise subsea production and inspection Optimising the design and delivery

  • f Capital Projects
slide-5
SLIDE 5

Concept Selection

Expected Outcomes

  • Shorter Operator internal

approvals schedule

  • More robust technical & cost

models

  • Reduced engineering hours
  • Enable engineers to run

more scenarios Opportunities

  • Digital tools to more quickly and

reliably evaluate concepts

  • Digitalisation & democratise 40+

years of subsea knowledge

  • Creating the Operational

feedback loop

  • Replication, standardization

using digital analogues

  • … Artificial Intelligence
slide-6
SLIDE 6
  • GIS-based concept optimization &

costing tool

  • Manage and compare multiple development

scenarios – optimizing Drilling vs Subsea vs Surface costs

  • Develop field architecture accurately using

GIS mapping capability and survey data

  • Check configuration against project specific

rules & automatically calculate quantities

  • Dynamic reports & charts from database for

ease of interpreting results

  • Provides reference repository for design &

cost information throughout project lifecycle

  • Produce accurate quantities and costs

estimates

ACE$ | Field Concept Development

CAPEX

slide-7
SLIDE 7

Enabling Successful Design Collaboration

7

? Model Centric Eng Integrated CAE Discrete Engineering Tools

Digital Twin

slide-8
SLIDE 8

BIM: Model Centric Engineering Approach

  • 1. Greater design coordination &

collaboration

  • 2. Upstream decision making &

fewer design changes

  • 3. Less rework, fewer change
  • rders
  • 4. Less drafting
  • 5. Quantities & cost estimating
  • 6. Schedule optimisation
slide-9
SLIDE 9

9

Benefits

Source: Dodge Data & Analytics, Bentley Systems

slide-10
SLIDE 10

Enabling Successful Design Collaboration

10

? Model Centric Eng Integrated CAE Discrete Engineering Tools

Common info/ data standards Greater information transparency Integrated Data Platforms

slide-11
SLIDE 11

Subsea Operations: Primed for Disruption

Operational Costs have increased by

300%

from 2002 to 2014

3-5% Ops data used

Unplanned events (failure, repair) Dependency

  • n large

vessels Dependency

  • n visual

inspection

50%+ assets 10yrs +

slide-12
SLIDE 12

Digital Enablers

12

Smart Technology & Robotics Data Analytics & Artificial Intelligence Process Digitalisation & Automation Digital Twin

slide-13
SLIDE 13

Halfing Subsea Inspection Costs

13

Reduce “nice to haves” Use existing production data to reduce scope of IMR Install monitoring systems to generate new data to reduce IMR further Use new Camera, LIDAR, AUV technology to accelerate remaining IMR wort

$4BN spent on IMR

Data Analytics & Visualisation Smart Tech (Sensors) & Analytics Smart Tech

Goal: $2BN 50% Cost Reduction

Growth for in New (substitute) Services & Capability

slide-14
SLIDE 14

Data analytics: Extracting value from the 95%

1. Data integration

  • Data handling, cleaning, integration

and storage solutions 2. Data Visualisation

  • Custom asset intelligence web

dashboards Reporting on key data, KPIs, alerts and notifications 3. Advanced analytics

  • Fault detection
  • Process optimisation
  • Operational optimisation
  • Forecasting
  • Cognitive computing
slide-15
SLIDE 15

Clear indicators in data from open and close events when performance is starting to degrade, i.e. P point from P-F curve can be predicted.

Data indicates healthy performance Signs of degrading performance No longer fit for purpose

Case Study: Valve Actuator Predictive Maintenance

slide-16
SLIDE 16
  • Disruptive change in ROV & autonomous

vehicle technology

– Subsea infrastructure

  • AUV Pipeline inspections
  • Infield ROV for normal infield inspection
  • Minaturised “suitcase” ROV inspection, esp near

surface (e.g. FPSO / turret based inspections)

  • ften at a fraction of cost of a DSV.

– Visualization Technology

  • LiDAR
  • Adv. Camera Technology

Smart Tech: AUV & Inspection Systems

16

Reference: Subsea 7, 3D at Depth, CAthx

slide-17
SLIDE 17
  • 2016 HMD & Foxconn
  • 30m/year phones
  • No. 1 in low cost market
  • No. 4 in UK sales

Where is Nokia now ?

slide-18
SLIDE 18

Thank you for listening