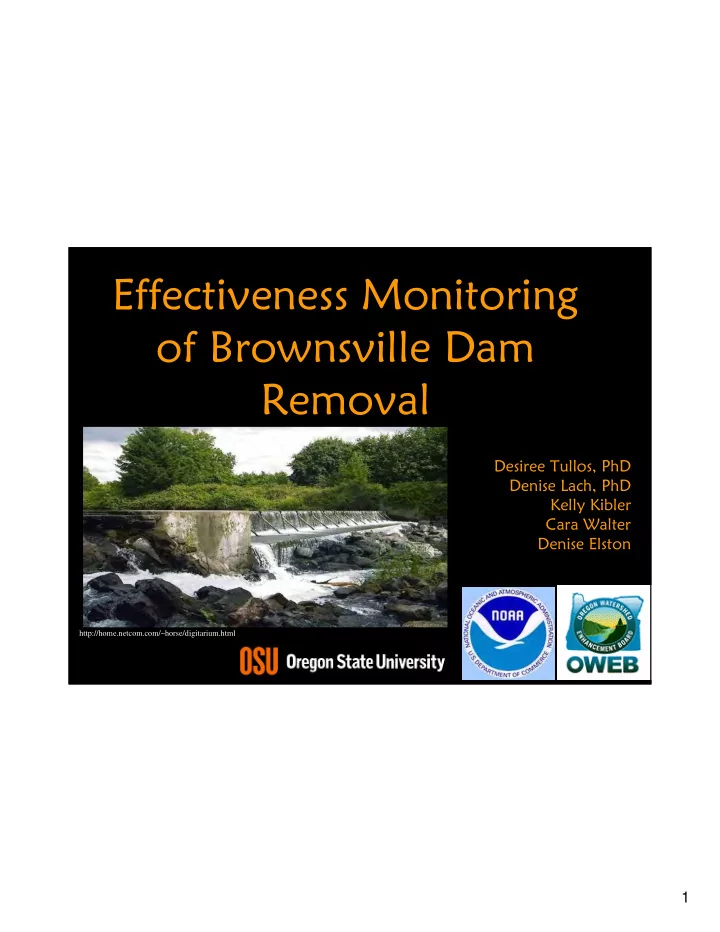

Effectiveness Monitoring of Brownsville Dam Removal Desiree Tullos, PhD Denise Lach, PhD Kelly Kibler Cara Walter Denise Elston http://home.netcom.com/~horse/digitarium.html 1
http://rivers.bee.oregonstate.edu/index.html 2
project objectives • Analyze and propose dam removal monitoring guidance – environmental “experiment designs” • Document extent, magnitude, and drivers of changes in Calapooia with dam removal • Provide foundation for long-term projections in Calapooia 3
change detection and small dam removal • lack of effect or lack of effective methods? • Statistical significance - do means mean anything? - Testing hypotheses about probabilities and predictability of geomorphic and biological responses • Ecological significance – using reliable biotic and abiotic indicators (e.g. responsiveness to disturbance/restoration, feasibility of measurement) 4
dam removal as environmental experiments Advantages • broad scale trend development • validation of conceptual and numerical models • identification of dominant processes and scales • real-world examples and observations Disadvantages • uncontrolled – challenges in hypothesis testing • spatial and time frames for expectations and recovery are unpredictable • risk – of wasting money, damaging infrastructure, being wrong… 5
study layout • Upstream • Reservoir • Downstream1 • Downstream 2 6
beyond a black BACI box • BACI – Before-After-Control-Impact • problems with BACI for environmental experiments – US/DS not independent – short/absent pre-removal – highly background variability – unspecific indicators – Insufficient sampling 7
ecological significance – understanding the links field observations numerical models physical models 8
the (un)usual suspects • physical – substrate size distribution – bulk samples, pebble counts – discharge – historical record extension and gaging – bedload and suspended sediment discharge – channel geometry, facies/features –total station • biological – coarse vegetation (ODFW) – benthic macroinverts (modified EMAP) – habitat quality (ODFW) • socio-economic 9
the unusual suspects – evidence from invertebrate traits Hydrologic disturbance Hydrologic disturbance restoration disturbance restoration disturbance • Reproductive cycle Reproductive cycle • Reproductive cycle Reproductive cycle • Lifespan Lifespan • Lifespan Lifespan • Body size Body size • Development rate Development rate • Body shape Body shape • Adult ability to exit Adult ability to exit • Dispersal Dispersal • Drift Drift • Habitat and trophic Habitat and trophic preferences preferences Tullos et al. (2008) 10
pre-removal invert traits site 1 2 3 Axis 2 Axis 1 Site 3 - upstream control, Site 2 - immediately downstream of the dam removal Site 1 - farthest downstream reach. 11
pre-removal habitat relative to watershed? relative to Willamette Valley? 12
analysis of methods and responses - sediment sampling 13
Informing removal outcomes - sediment transport Uncertainty and accuracy – predictive equations – evacuation rates – fate of stored sediment 14
Hydrology of the Calapooia Kelly Kibler PhD – Water Resources Engineering 15
Gauging the Calapooia at Brownsville: River Discharge (Q) •What is Q? •measure of the volume of water that flows past a given point in the river per unit of time •units- cubic feet per second (cfs) •Why measure Q? •aquatic habitat •sediment transport 16
Brownsville Gauging Station 17
Brownsville Gauging Station 18
Brownsville Gauging Station 19
Brownsville Gauging Station W at ater D Dept pth at at C Cal alapo apooia G a Gau auging S g Stat ation 8 7 6 eet 5 4 feet 3 2 1 0 9/15 15 10 10/15 11/ 11/14 14 12 12/14 1/13 2/12 20
USGS Mid-section method 21
USGS Mid-section method Area X velocity = Q feet 2 X ft/second = cfs ∑ Qsection =Qriver 22
Calapooia at low Q Easy to wade 23
Calapooia at high Q- unsafe to wade 24
Calapooia at high Q- unsafe to wade- but we can use the bridge. 25
Bridge gauging equipment 26
Bridge gauging equipment Our plan: measure Q once a week 27
Historical and post-removal channel change Cara Walter MS – Water Resources Engineering 28
Flow ± Aerial photo courtesy of Linn County GIS 29
Field Measurements 30
31
Discharge Comparison 32
Annual Peak Discharge 1948-2007 14000 12000 10000 D ischarge (cfs) 8000 6000 4000 3520 2000 0 1948 1953 1958 1963 1968 1973 1978 1983 1988 1993 1998 2003 Year Calapooia River at Holley, OR Mohawk River near Springfield, OR Wiley Creek near Foster, OR Calapooia River at Holley, Estimated 33
Reservoir Channel Changes 10-08-2007 Flow Dam crest 34
11-07-2007 35
12-12-2007 36
1-11-2008 37
2-08-2008 38
Downstream Channel Changes 39
Downstream Channel Changes 40
10-08-2007 41
10-08-2007 42
11-07-2007 43
2-08-2008 44
Socio-economic Impacts of Removal Denise Elston MS – Water Resources Science and Policy 45
Why Brownsville? • It is one of the first in the nation under the National Oceanic and Atmospheric Administration's new Open Rivers Initiative (ORI) • Partnerships, working together for healthy streams and community benefits • Establishes monitoring and provides an opportunity to look at the whole story over a longer period of time 46
What Makes This Study Important • Currently, no comprehensive social impact analysis on small dam removal • The opportunity to design a “template” for other removals • Learn what makes successful community participation in future dam removals 47
What is a Social Impact Analysis (SIA)? • It is “the process of analyzing, monitoring, and managing the intended and unintended consequences, both positive and negative, of planned interventions” (International Association for Impact Assessment pamphlet, 2006) 48
Components of Analysis • Develop a baseline • Identify appropriate social indicators • Identify appropriate economic indicators • Operationalize (measure) the indicators • Ensure methods and assumptions are transparent and replicable 49
What are Indicators? • Variables which are considered in a study to provide information that could be used to determine social impacts that might exist in a particular community. • A measure of the well-being of society and of its citizen 50
Potential Impacts of Dam Removal • Health and Social Well- being • Quality of the Living Environment • Economic and Material Well-being • Cultural Effects • Family and Community • Institutional, Legal, Political, and Equality 51
Recommend
More recommend